Join us for an event September 26!
How to Streamline RNA-Seq analysis and increase productivity—point, click, and done
Page History
...
| Numbered figure captions | ||||
|---|---|---|---|---|
| ||||
|
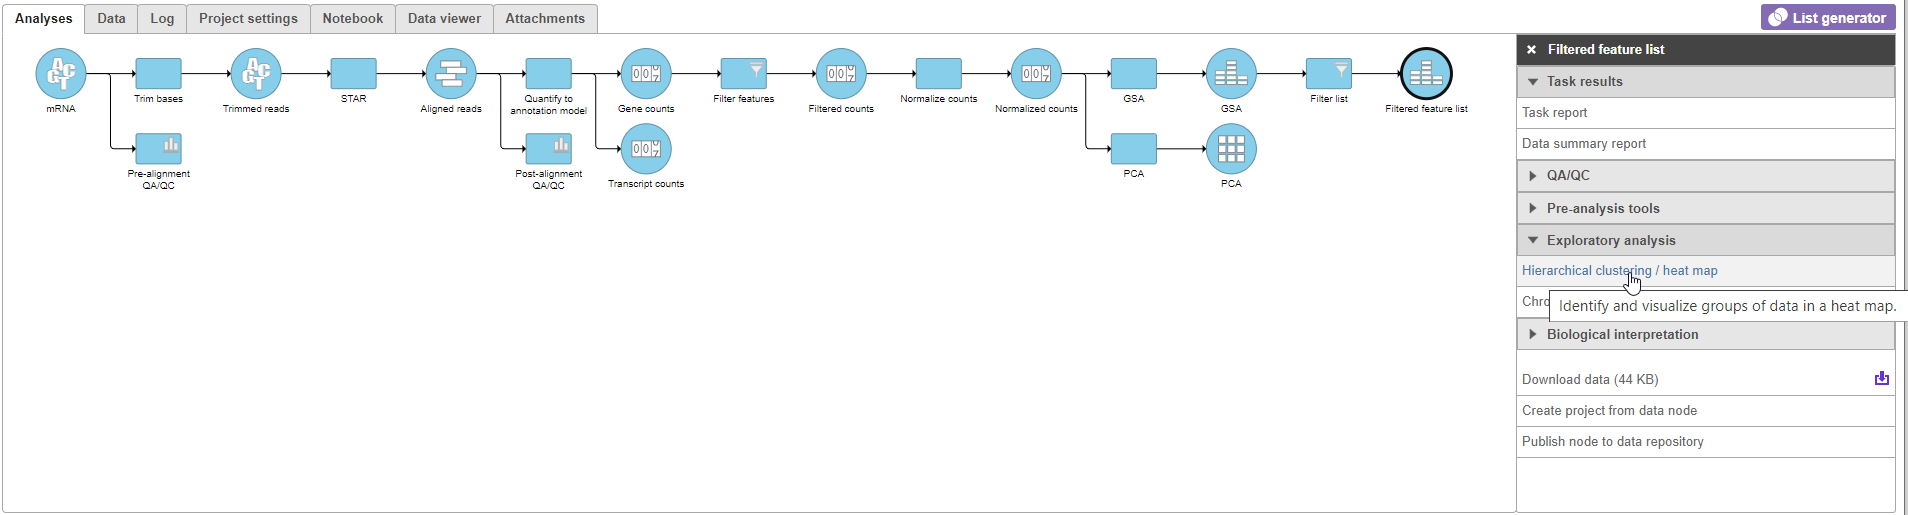
The Hierarchical clustering menu will open (Figure 2). Hierarchical clustering can be performed with a heatmap or bubble map plot. Cluster must be selected under Ordering for both Feature order and Cell order if both the features (columns) and cells (rows) are to be clustered.
...
| Numbered figure captions | ||||
|---|---|---|---|---|
| ||||
|
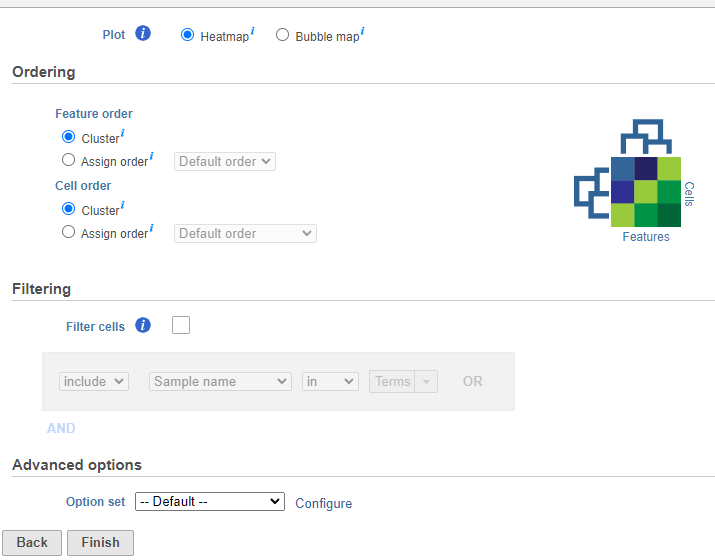
- Click Finish to run with default settings
...
| Numbered figure captions | ||||
|---|---|---|---|---|
| ||||
|
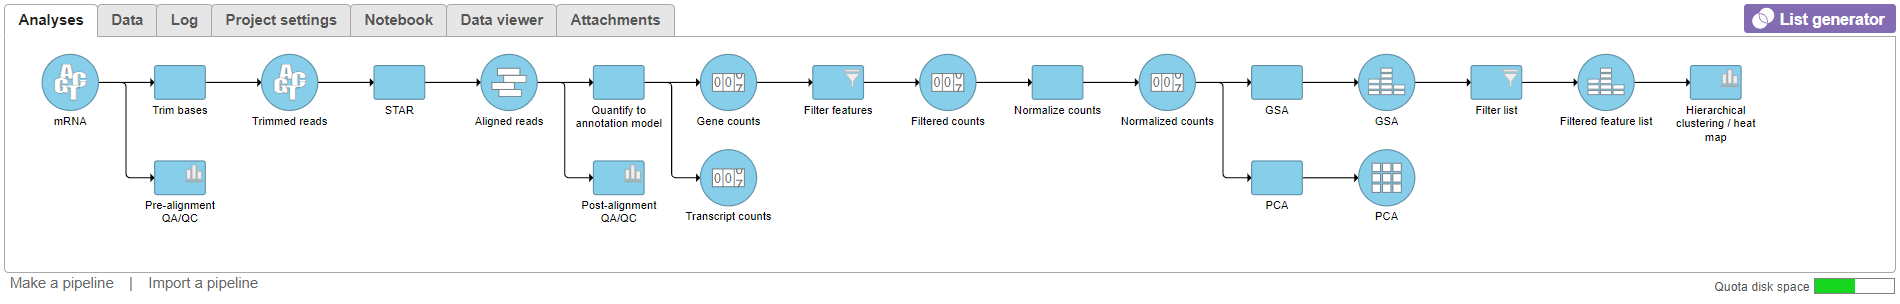
- Double-click the Hierarchical clustering / heatmap task node to launch the heatmap
...
| Numbered figure captions | ||||
|---|---|---|---|---|
| ||||
|
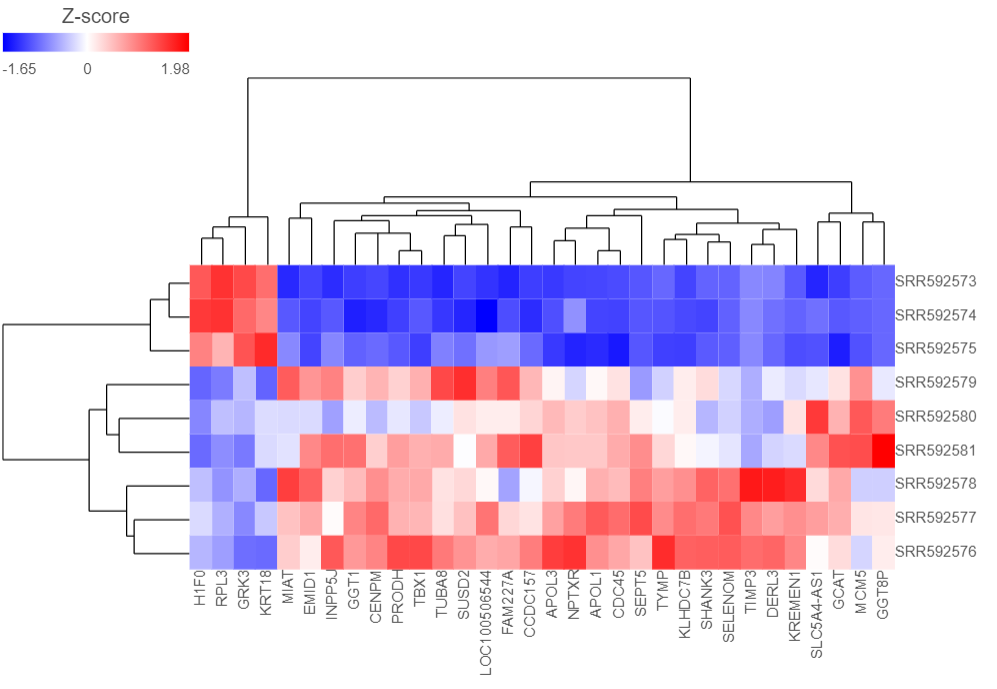
Samples are shown on rows and genes on columns. Clustering for samples and genes is shown through the dendrogram trees. More similar samples/genes are separated by fewer branch points of the dendrogram tree.
...
| Numbered figure captions | ||||
|---|---|---|---|---|
| ||||
|
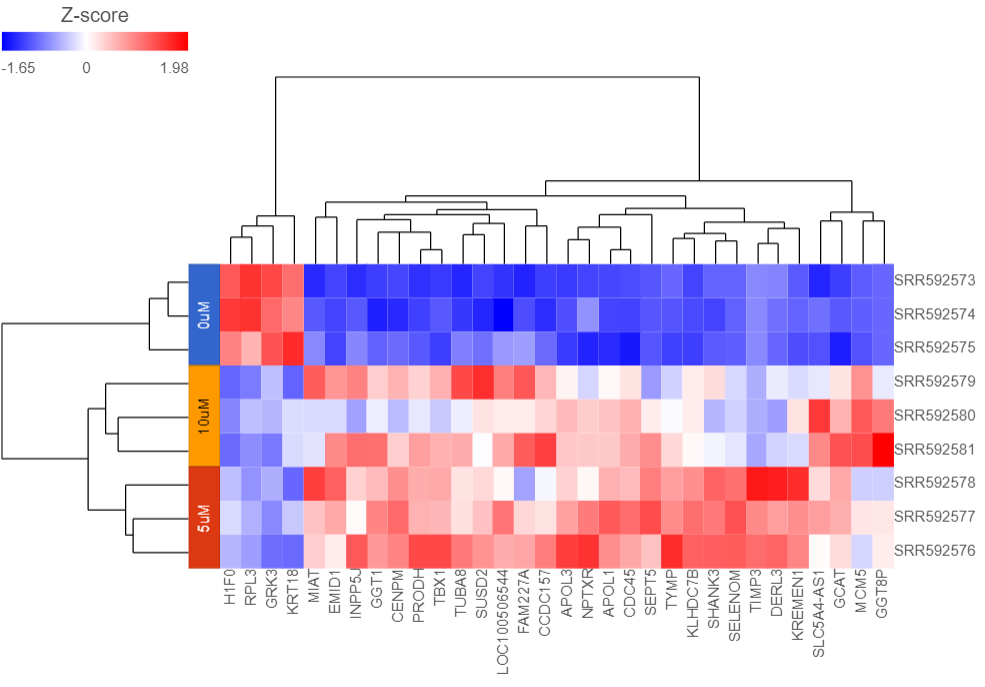
Samples cluster based on treatment group and the 5μM and 10μM groups are more similar to each other than to the 0μM group.
...
| Numbered figure captions | ||||
|---|---|---|---|---|
| ||||
|
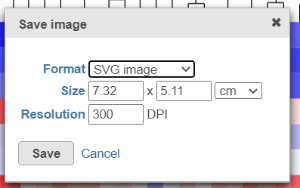
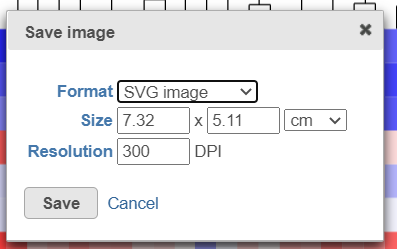
- Select Save
The heatmap will be saved as a .svg file and downloaded in your web browser.
...
Overview
Content Tools