Page History
| Table of Contents | ||
|---|---|---|
|
What is Cell Ranger?
Cell Ranger is a set of analysis pipelines that process Chromium single-cell RNA-seq output to align reads, generate feature-barcode matrices and perform clustering and gene expression analysis for 10X Genomics Chromium Technology[1].
Cell
...
Ranger - Gene Expression in Partek Flow
Cell Ranger v6.0.0[2] has been wrapped in Partek® Flow® as Cell rangerRanger - Gene Expression task. It does not comprehensively cover all of the options and analysis cases Cell Ranger can handle for now, but converts FASTQ files from cellranger mkfastq and performs alignment, filtering, barcode counting, UMI counting for single cell gene expression and Feature Barcode data. The output gene expression count matrix in .h5 format (both raw and filtered available for users to download in the output page of task details) then becomes the starting point for downstream analysis for scRNA-seq in Flow.
Note: when When use Cell ranger Ranger - Gene Expression task in Partek Flow, there is are more restrictions on sampe sample name -- sample name can only contain letters, digits, underscores and dashes. Please Edit edit the sample names on Data tab in Partek Flow to remove any other characters ,e.g. space etc.
Running Cell
...
Ranger - Gene Expression in Flow
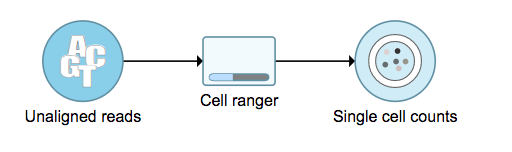
To run the Cell rangerRanger - Gene Expression task in Flow, select Unaligned reads datanode, then select Cell rangerRanger - Gene Expression in the 10x Genomics section (Figure 1).
...
| Numbered figure captions | ||||
|---|---|---|---|---|
| ||||
|
Cell ranger task report in Flow
Task report is sample based. Users can use the dropdown list on the top left to switch samples. Under the sample name, there are two tabs on each report - Summary report and Analysis report (Figure 7). Important information on Estimated Number of Cells, Mean Reads per Cell, Median Genes per Cell, as well as information on Sequencing, Mapping, and Sample are summarized in different panels. The Barcode Rank Plot has also been included as an important piece in the Cells panel in the Summary report (Figure 7).
...
Force cells: Force pipeline to use this number of cells, bypassing the cell detection algorithm. Use this if the number of cells estimated by Cell Ranger is not consistent with the barcode rank plot.
References
https://support.10xgenomics.com/single-cell-gene-expression/software/overview/welcome
https://support.10xgenomics.com/single-cell-gene-expression/software/pipelines/6.0/release-notes
- https://support.10xgenomics.com/single-cell-gene-expression/software/pipelines/4.0/release-notes
...
Overview
Content Tools