Page History
...
- View. The icons in the View column open the enrichment plot (
 ) or the extra details report (
 ) (explanations below).
 - Gene set ID. The Gene set IDs are based on the gene set file that was selected during set up. Each ID is a link to the geneontology.org page of the selected set.
- Gene set size. Number of genes in the set (as specified in the gene set file).
- Enrichment score. The enrichment score reflects the degree to which the current gene set is overrepresented at the top or the bottom of the ranked list of all the genes in the gene model (for details, see the References). The higher the enrichment score the more overrepresented (enriched) the gene set is.
- Normalised score. Normalisation of the enrichment score takes into account the size of the gene set. We recommend to use normalised values for filtering.
- P-value. P-value estimates the statistical significance of the enrichment score.
- FDR. False discovery rate (FDR) is used to control for multiple testing. We recommend to use FDR values for filtering.
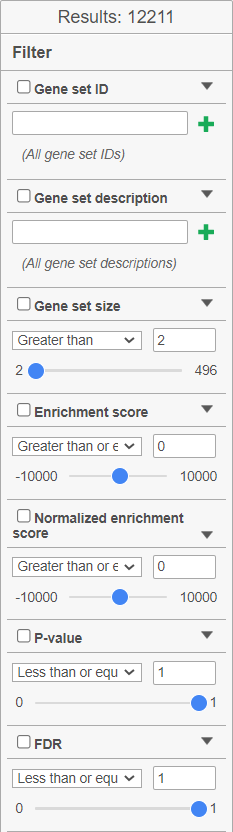
The filter panel is used to narrow the list of gene sets. The Results shows the number of gene sets currently in the table. Filtering can be performed on: Gene set ID (search for the numeric ID), Gene set description (search for a key word), Gene set size (number of genes in the set), Enrichment score, Normalised enrichment score, P-value, FDR. Click on the black triangle ![]() to open the controls for each filter (Figure 10). To remove all the filters, click on the Clear filter link. If you commonly use a filter, you can save the filter settings by clicking the Save filter button. The saved filter will be shown under Saved filters. The cogwheel icon (
to open the controls for each filter (Figure 10). To remove all the filters, click on the Clear filter link. If you commonly use a filter, you can save the filter settings by clicking the Save filter button. The saved filter will be shown under Saved filters. The cogwheel icon (![]() ) is a link to Settings > Filter management page.
) is a link to Settings > Filter management page.
| Numbered figure captions | ||||
|---|---|---|---|---|
| ||||
|
References
- Subramanian A, Tamayo P, Mootha VK, et al. Gene set enrichment analysis: a knowledge-based approach for interpreting genome-wide expression profiles. Proc Natl Acad Sci U S A. 2005;102(43):15545-15550. doi:10.1073/pnas.0506580102
- Mootha VK, Lindgren CM, Eriksson KF, et al. PGC-1alpha-responsive genes involved in oxidative phosphorylation are coordinately downregulated in human diabetes. Nat Genet. 2003;34(3):267-273. doi:10.1038/ng1180
Overview
Content Tools