Page History
...
| Numbered figure captions | ||||
|---|---|---|---|---|
| ||||
|
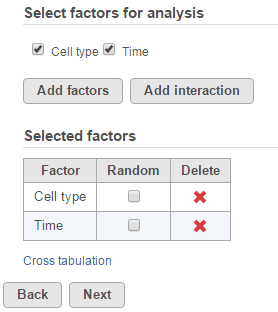
When more than one factor is selected, click Add interaction button will be enabled to allow you to specify interactionto add interaction term of the selected factors.
Once a factor is added to the model (Figure 14), you can specify whether the factor is a random effect (check Random check box) or not.
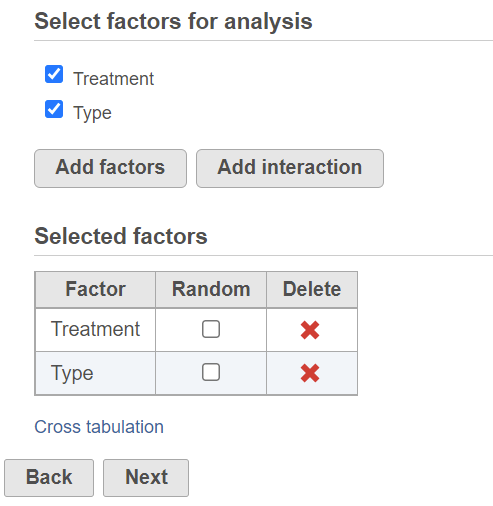
Most factors in an analysis of variance are fixed factors, i.e. the levels of that factor represent all the levels of interest. Examples of fixed factors include gender, racetreatment, straingenotype, etc. However, in experiments that are more complex, a factor can be a random effect, meaning the levels of the factor only represent a random sample of all of the levels of interest. Examples of random effects include subject and batch.Consider Consider the example where one factor is type (with levels normal and diseased), and another factor is subject (the subjects selected for the experiment). In this example,
“type” “Treatment” is a fixed factor since the levels normal treated and diseased control represent all conditions of interest. “Subject”, on the other hand, is a random effect since the subjects are only a random sample of all the levels of that factor. When model has both fixed and random effect, it is called a mixed model.
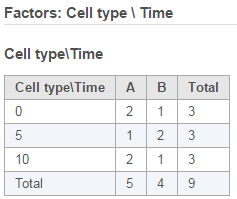
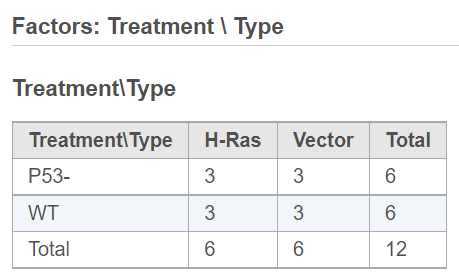
When more than one factor is added to the model, click on the Cross tabulation link at the bottom to view the relationship between the factors in a different browser tab (Figure 2).
| Numbered figure captions | ||||
|---|---|---|---|---|
| ||||
|
Once the model is set, click on Next button to setup comparisons (contrasts) (Figure 3).
| Numbered figure captions | ||||
|---|---|---|---|---|
| ||||
|
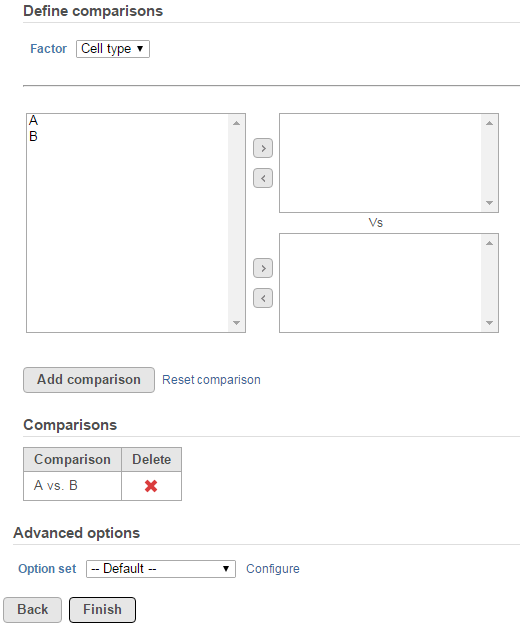
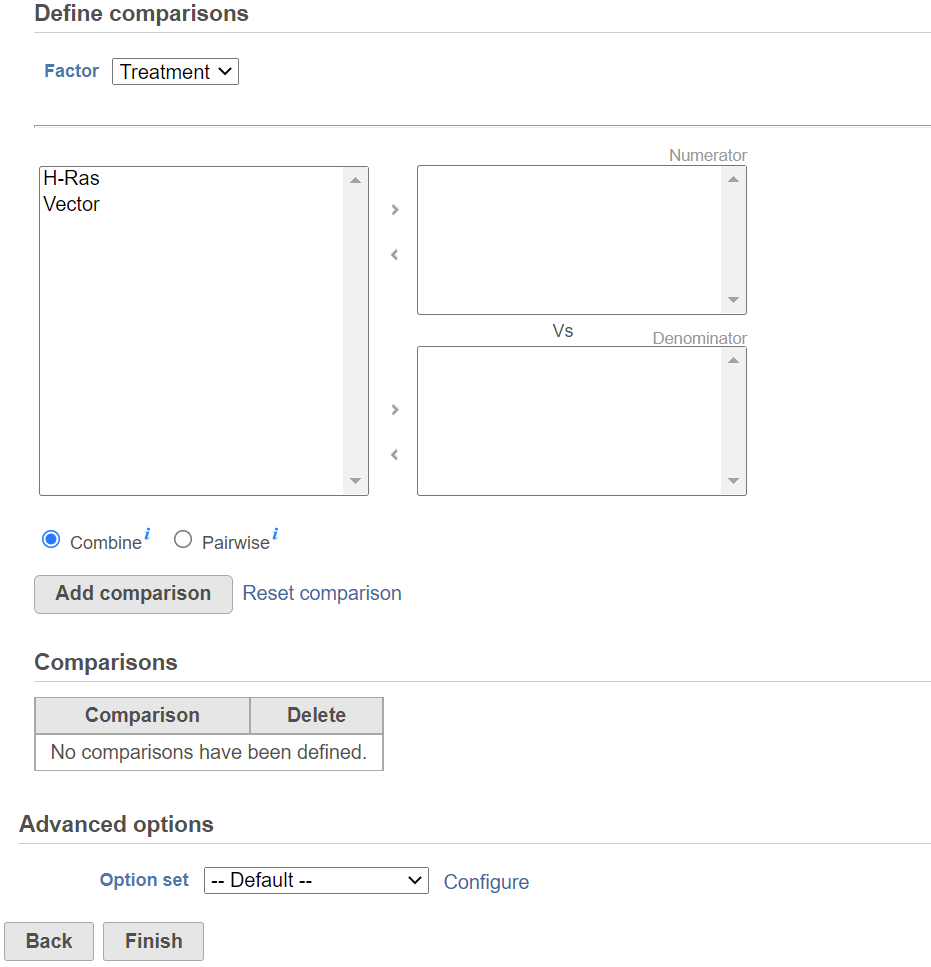
Start by choosing a factor or interaction from the Factor drop-down list. The subgroups of the factor or interaction will be displayed in the left panel; click to select one or more more level(s) or subgroup name(s) and move them to one of the panels boxes on the right. The ratio/fold change calculation on the comparison will use the group in the top panel box as numerator, and the group in the bottom panel box as the denominator. Click When multiple levels (groups) are in either numerator or denominator box(es), in Combine mode, click on Add comparison button to add one comparison to the comparisons table. Note that multiple comparisons can be added to combine all numerator levels and combine all denominator levels in a single comparison in the Comparison table below; in Pairwise, click on Add comparison button will split all numerator levels and denominator levels into a factorial set of comparisons – in other words, it will add every numerator level paired with every denominator level comparisons to the Comparison table . Multiple comparisons from different factors can be added from the specified model.
ANOVA advanced options
...
| Numbered figure captions | ||||
|---|---|---|---|---|
| ||||
|
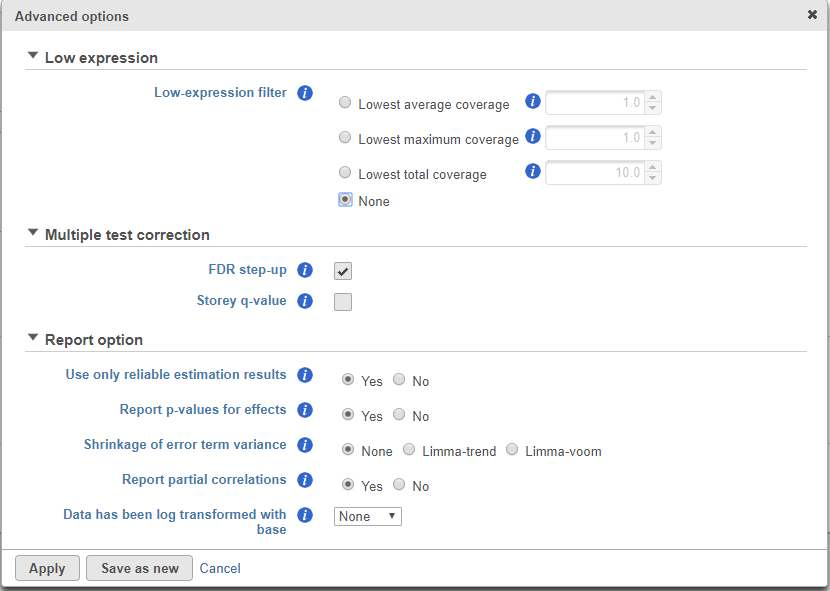
Low-expression feature and Multiple test correction sections are the same as the matching GSA advanced option, see above GSA advanced options.
...
Overview
Content Tools