Page History
...
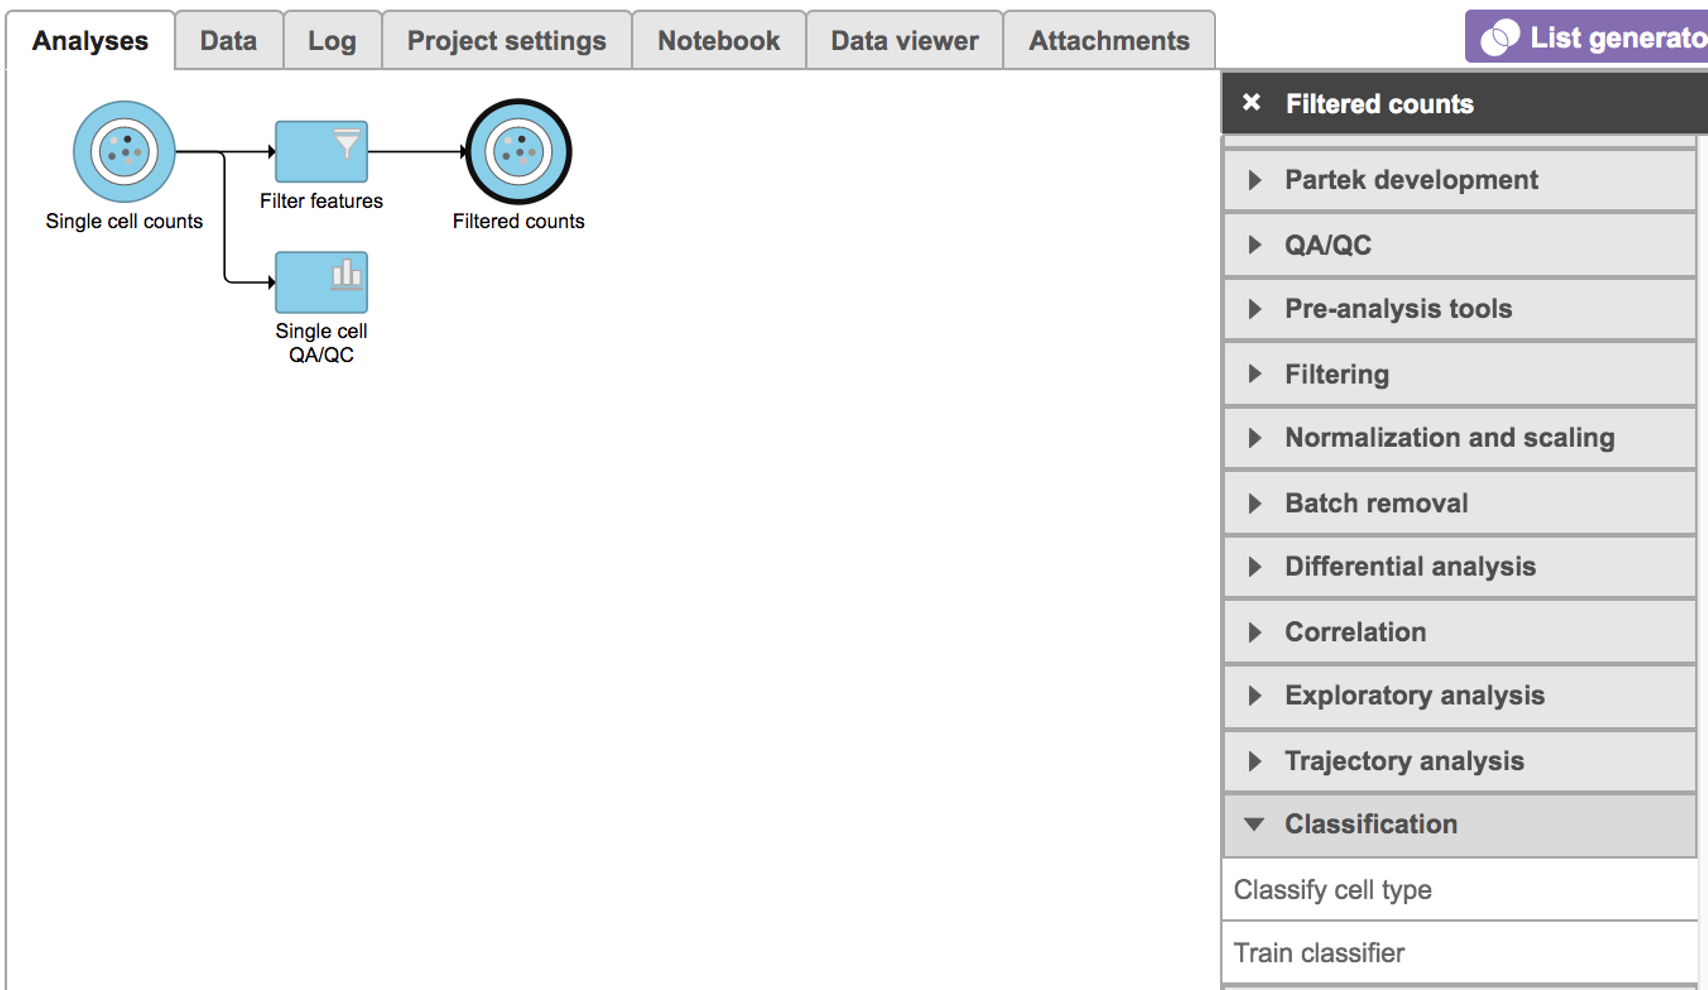
Select any non-normalized single cell data node, Filter counts here Choose here which contains raw count, choose Classify cell type task in Classification section (Figure 1)
...
| Numbered figure captions | ||||
|---|---|---|---|---|
| ||||
|
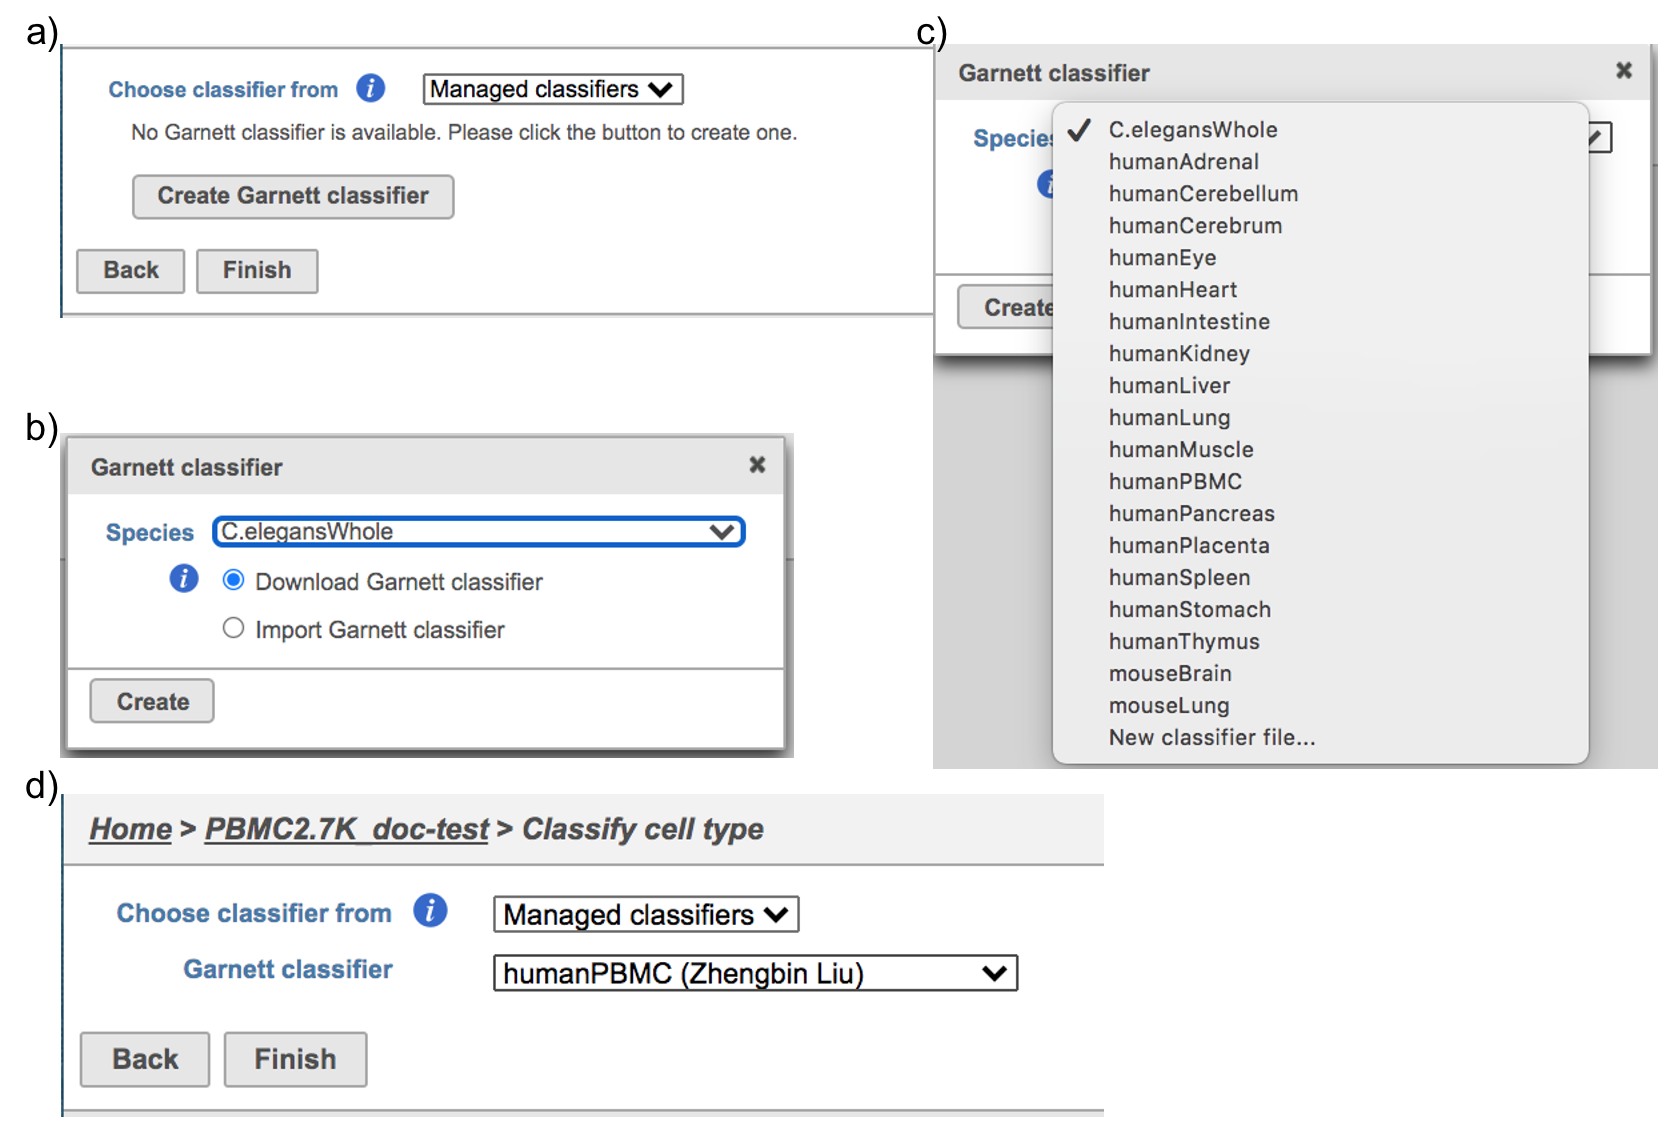
Managed classifiers users will be asked to create a new classifier file if it is the first time to run the task in Flow (Figure 2a). Users could select either Download Garnett classifier that matches the species and tissue type with the dataset working on from Flow maintaining list or Import Garnett classifier that’s trained out of Flow (Figure 2b). Then push the Create button to create the classifier file. Once the right classifier file has been created, Select Finish to start running the task (Figure 2d).
...
| Numbered figure captions | ||||
|---|---|---|---|---|
| ||||
|
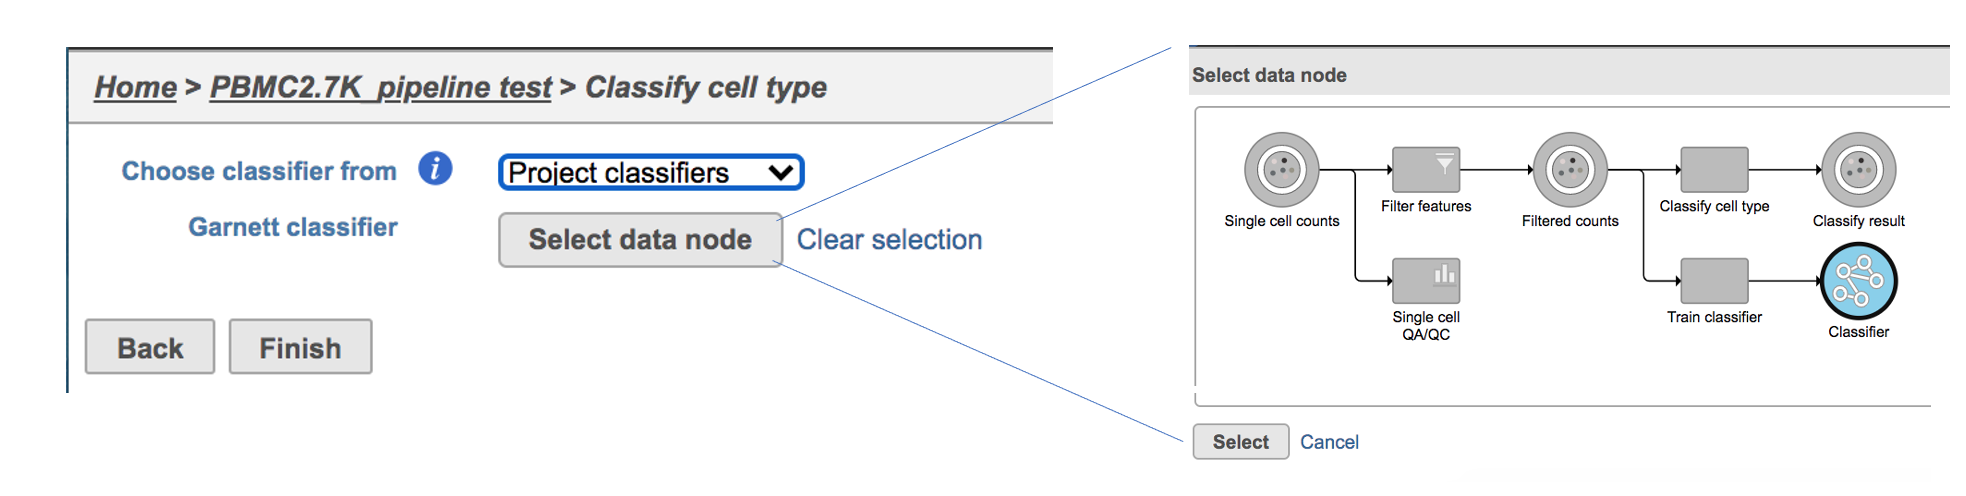
If users would like to classify cell type with the classifier obtained from the same project, ‘Project classifiers’ needs to be picked up from the dropdown list, then use ‘Select data node’ to choose the classifier before clicking the Finish button (Figure 3).
| Numbered figure captions | ||||
|---|---|---|---|---|
| ||||
|
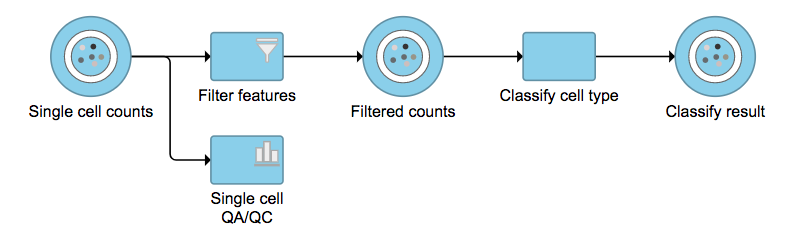
No matter which type of classifier was applied, it will output a new datanode data node named Classify result (Figure 4). The outputs of cell type annotation are exactly the same as Garnett[1]. Downstream analysis like normalization, PCA, etc can be run on Classify result data node.
| Numbered figure captions | ||||
|---|---|---|---|---|
| ||||
|
Train classifier in Flow
...
Select any non-normalized single cell data node, Filter counts here Choose here, choose Train classifier task in Classification section (Figure 1)
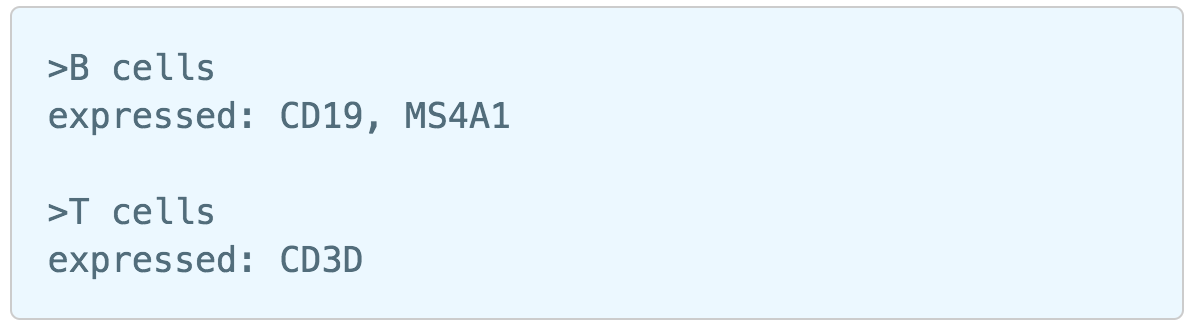
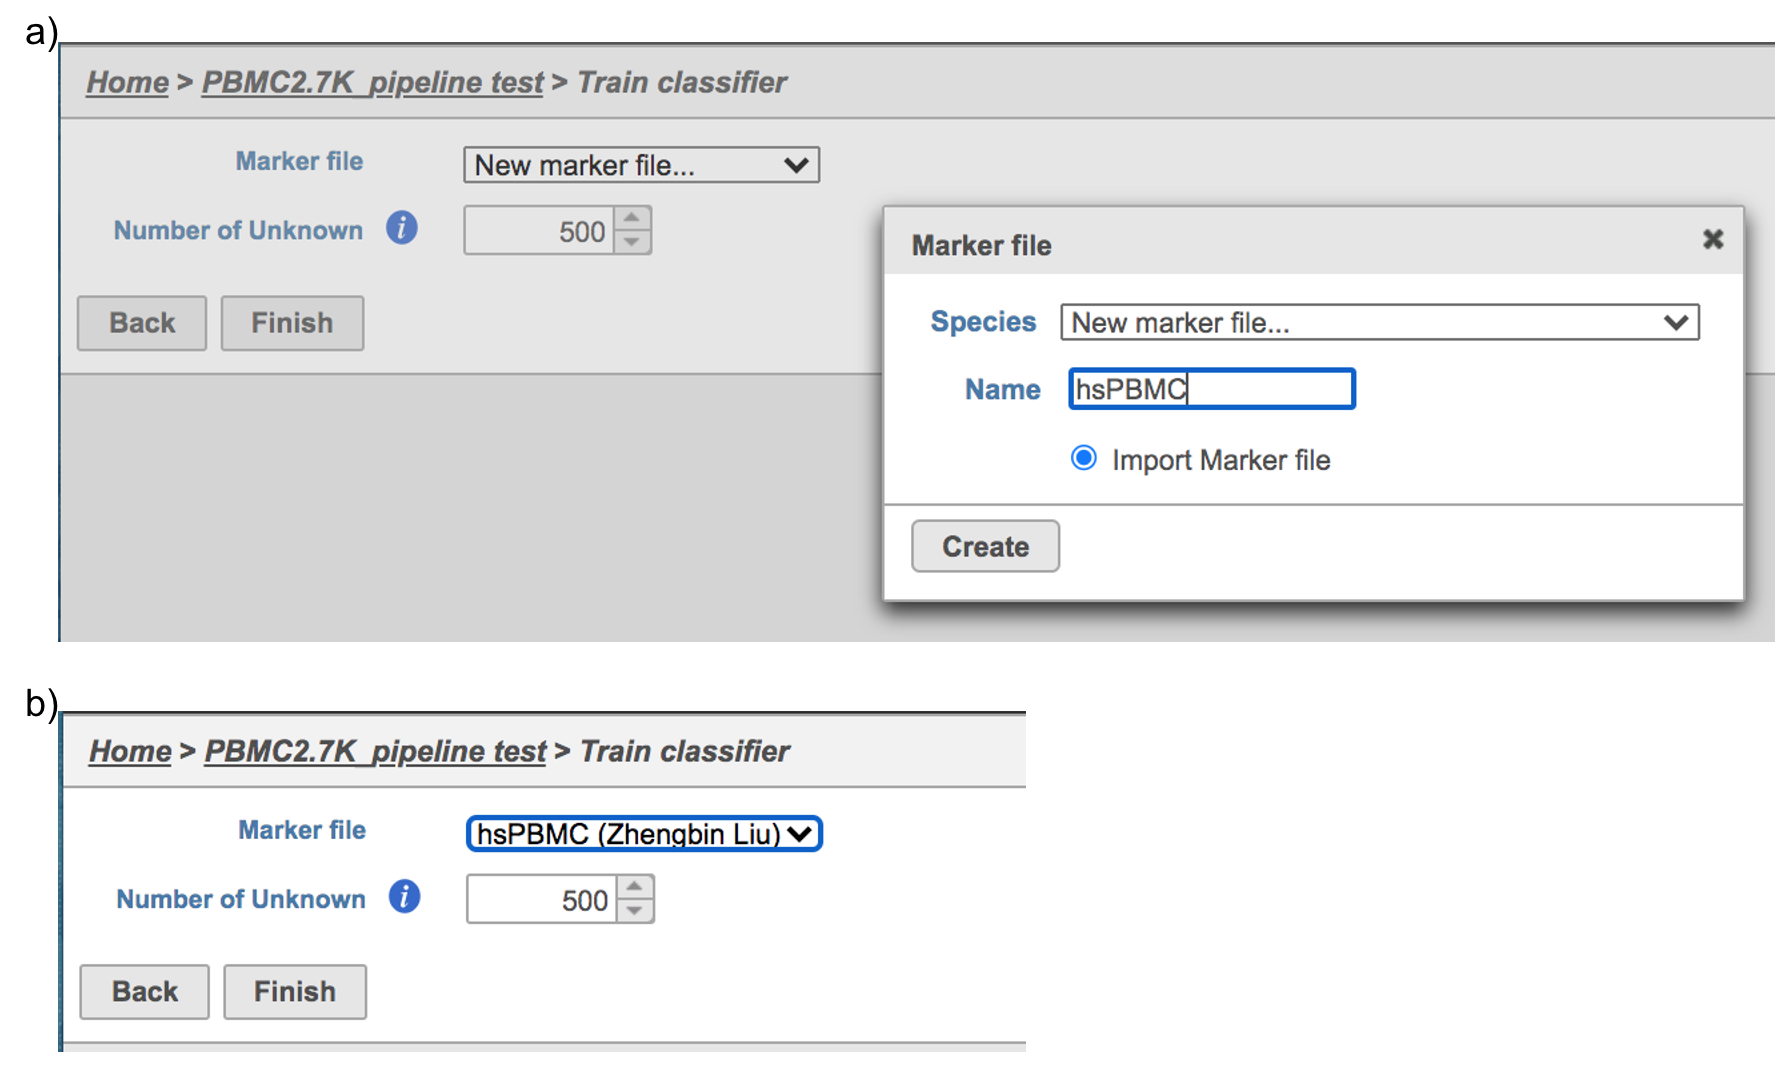
Similarly, first time users will be asked to create the Marker file at the very first beginning. Since . Partek Flow currently doesn’t host any marker files although , users can add them as library files. Users have to import the file they created outside of Flow. Marker file should be a .txt file with the marker information in correct format. The same example in the Garnett tutorial of a simple valid Marker file is provided here (Figure 5). For more details on how to construct a Marker file, please refer to Garnett tutorial[3]. Click Create button, Flow will then save the file with the name that users provided for future use (Figure 6a).
| Numbered figure captions | ||||
|---|---|---|---|---|
| ||||
|
After the proper Marker file has been chosen, click the Finish button to start running the task as default (Figure 6b).
| Numbered figure captions | ||||
|---|---|---|---|---|
| ||||
|
Train classifier task report in Flow
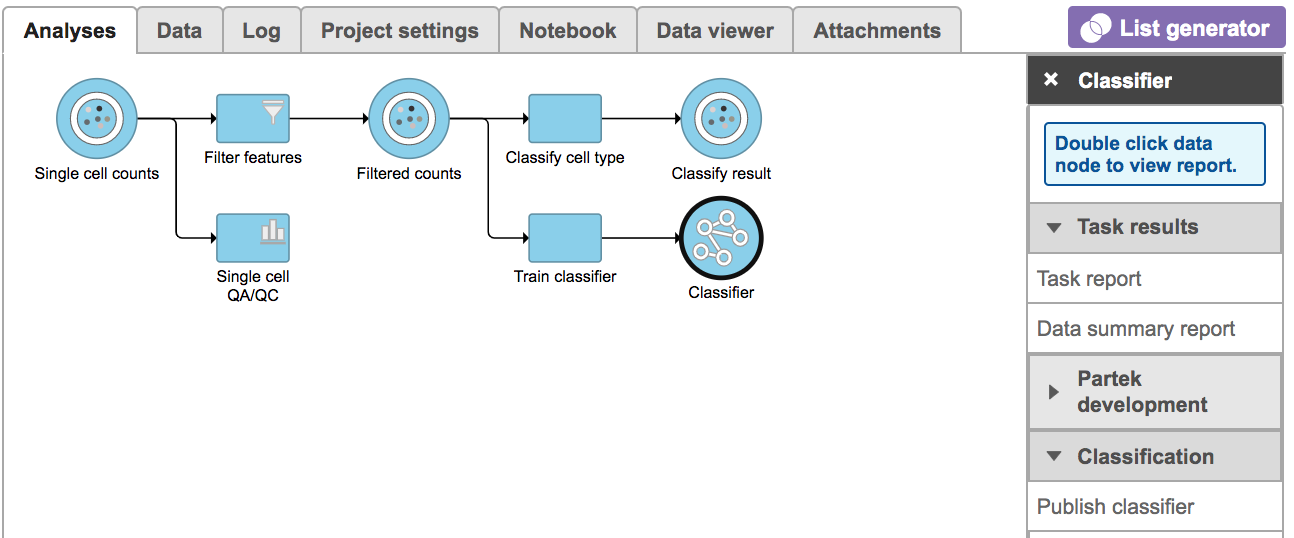
Once the task has been finished, click the Classifier datanode and find choose the Task report in the Task results section, or prompt it to be one of the Managed classifiers by clicking the Publish classifier task in Classification section (Figure 7).
...
| Numbered figure captions | ||||
|---|---|---|---|---|
| ||||
|
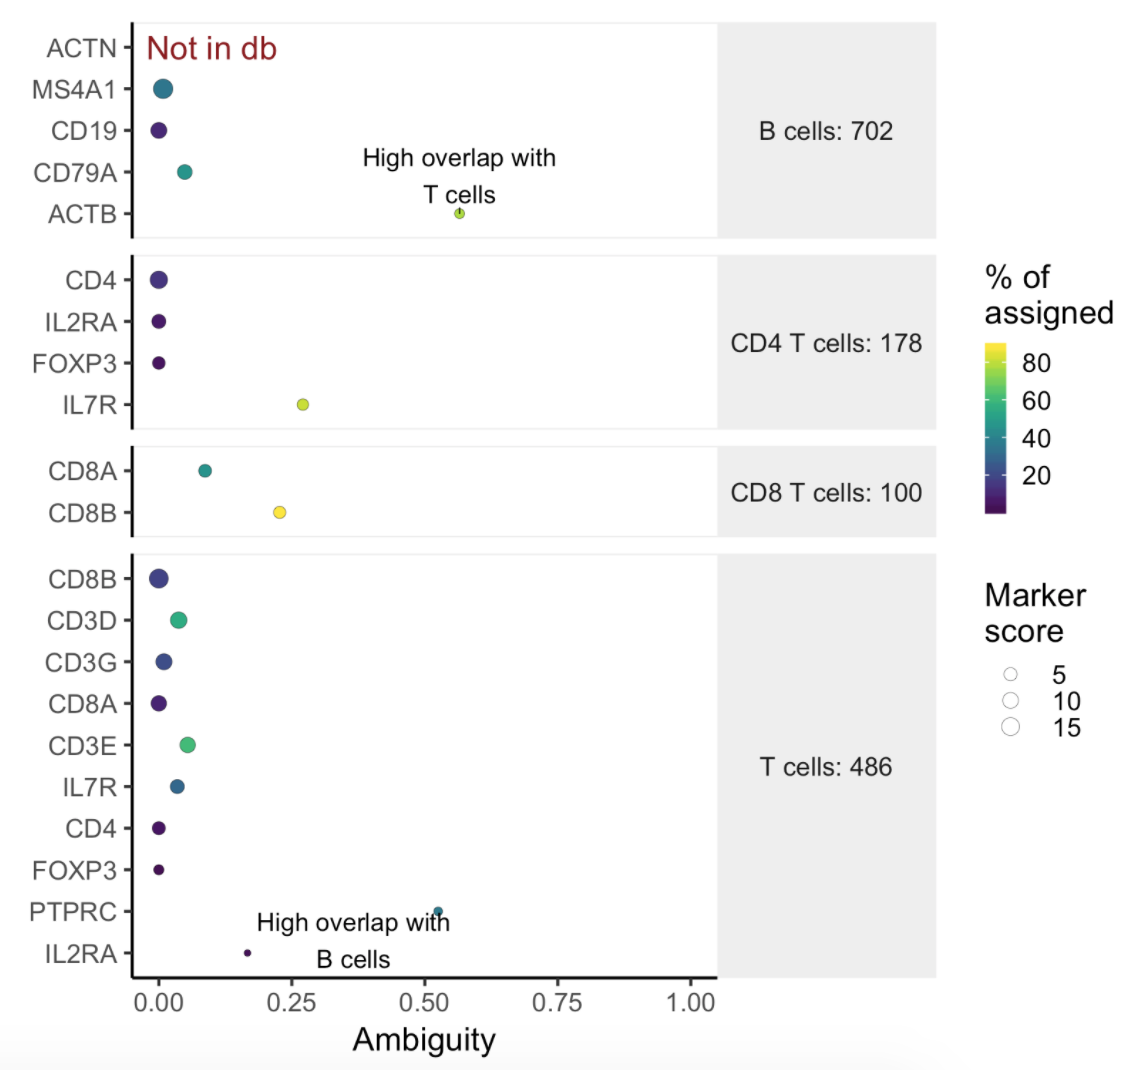
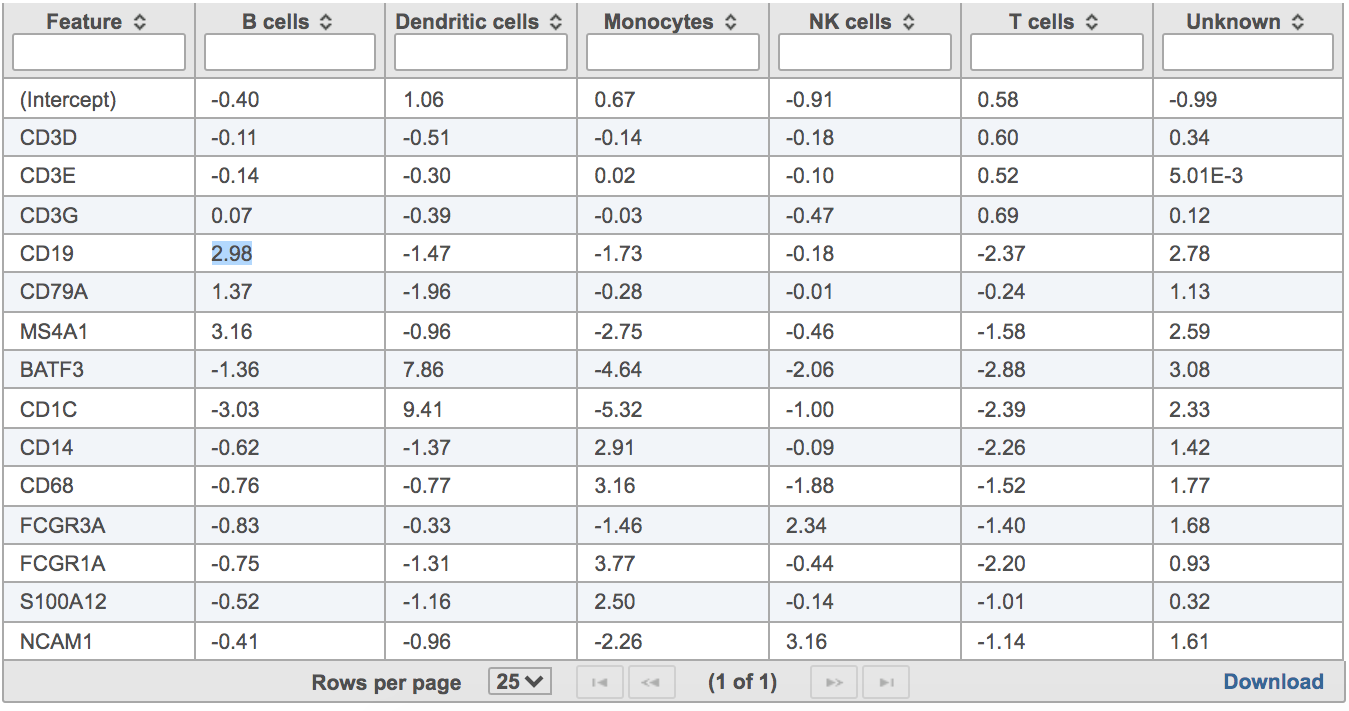
Users will find two parts in the task report: marker evaluation plot (Figure 8) and the classification gene table (Figure 9). The marker evaluation plot provides some key information about whether the chosen markers are good. Ambiguity scores are calculated for each of the markers which indicates how many cells receive ambiguous labels when this marker is included. The classification gene table could give a hint to which genes are chosen as the relevant genes for distinguishing between different cell types.
| Numbered figure captions | ||||
|---|---|---|---|---|
| ||||
|
| Numbered figure captions | ||||
|---|---|---|---|---|
| ||||
|
...
Overview
Content Tools