Page History
...
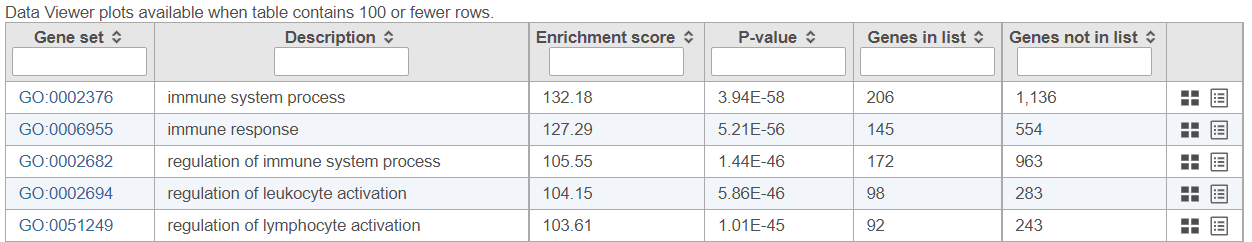
If the gene set enrichment table has fewer than 100 results (rows), the GO categories can be vizualized visualized in the Data Viewer. Otherwise, a notification is displayed in the top left corner (Figure 7).
| Numbered figure captions | ||||
|---|---|---|---|---|
| ||||
| ||||
|

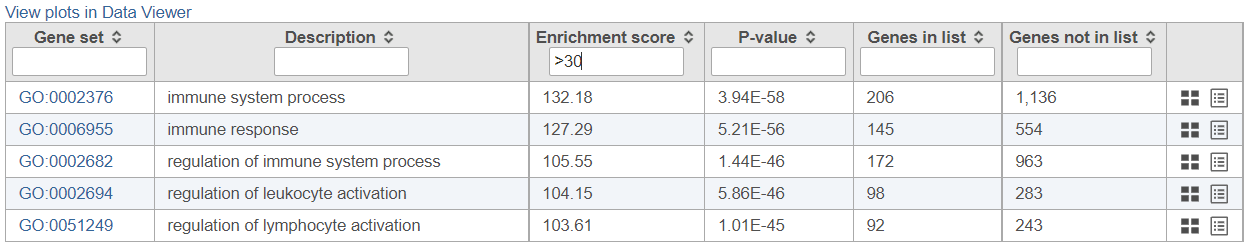
If needed, filter down the number results, for instance by using a cut-off based on the enrichment score. Type in the cut-off value in the text box beneath the Enrichment score and hit enter (an example is shown in Figure 8). Once the number or results falls below 100, a link to the Data Viewer will be displayed (Figure 8). Click on the View plots in Data Viewer link to open a new Data Viewer session.
| Numbered figure captions | ||||
|---|---|---|---|---|
| ||||
|
References
- Ashburner M, Ball CA, Blake JA et al. Gene Ontology: tool for the unification of biology. Nat Genetics. 2000; 25:25-29.
- The Gene Ontology Consortium. Gene Ontology Consortium: going forward. Nucleic Acids Res. 2015; 43:D1049-1056.Recommended citations from the Geneontology.org website
...
Overview
Content Tools