Page History
...
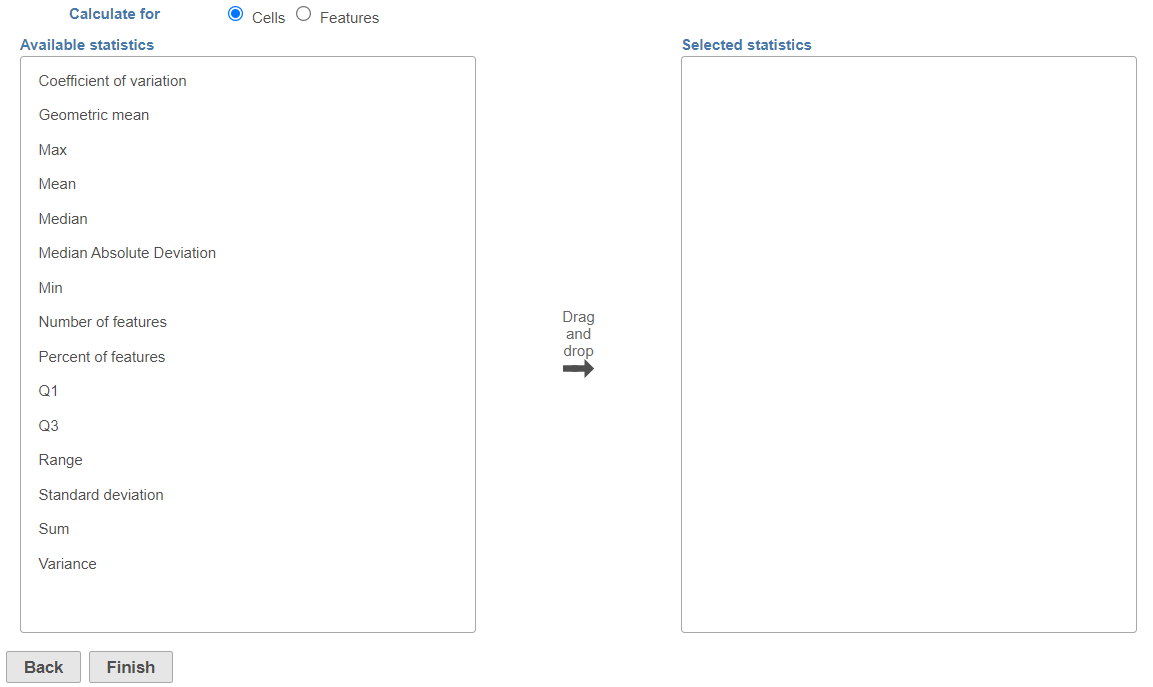
This will invoke the dialog (Figure 2), select the calculation will be performed on samples cells (or cells on a single cell count samples for a bulk analysis data node) (Figure 2) or features (Figure 3). Use the Group by option (available for feature-level report) to report the selected statistics per group (e.g. mean and standard deviation per cell type); pick a group from the drop down list and then push the green cross (![]() ) add it.
) add it.
| Numbered figure captions | ||||
|---|---|---|---|---|
| ||||
 | ||||
|
| Numbered figure captions | ||||
|---|---|---|---|---|
| ||||
|

The available statistics are listed on the left panel, suppose "x1, x2, ..., xn"represent an array of numbers
- Coefficient of variation (CV):
 s represent the standard deviation
 - Geometric mean: g=

- Max:
- Mean:

- Median: when n is odd, median is
 , when n is even, median is
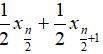
- Median absolute deviation:
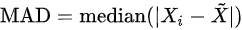 , where
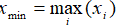
- Min:
- Non zero count: number of observations that is not zeroNumber of cells: This option reports the absolute number of cells whose
- Non zero percent: percentage of observations that is not zero
...
Overview
Content Tools