Page History
...
| Numbered figure captions | ||||
|---|---|---|---|---|
| ||||
|
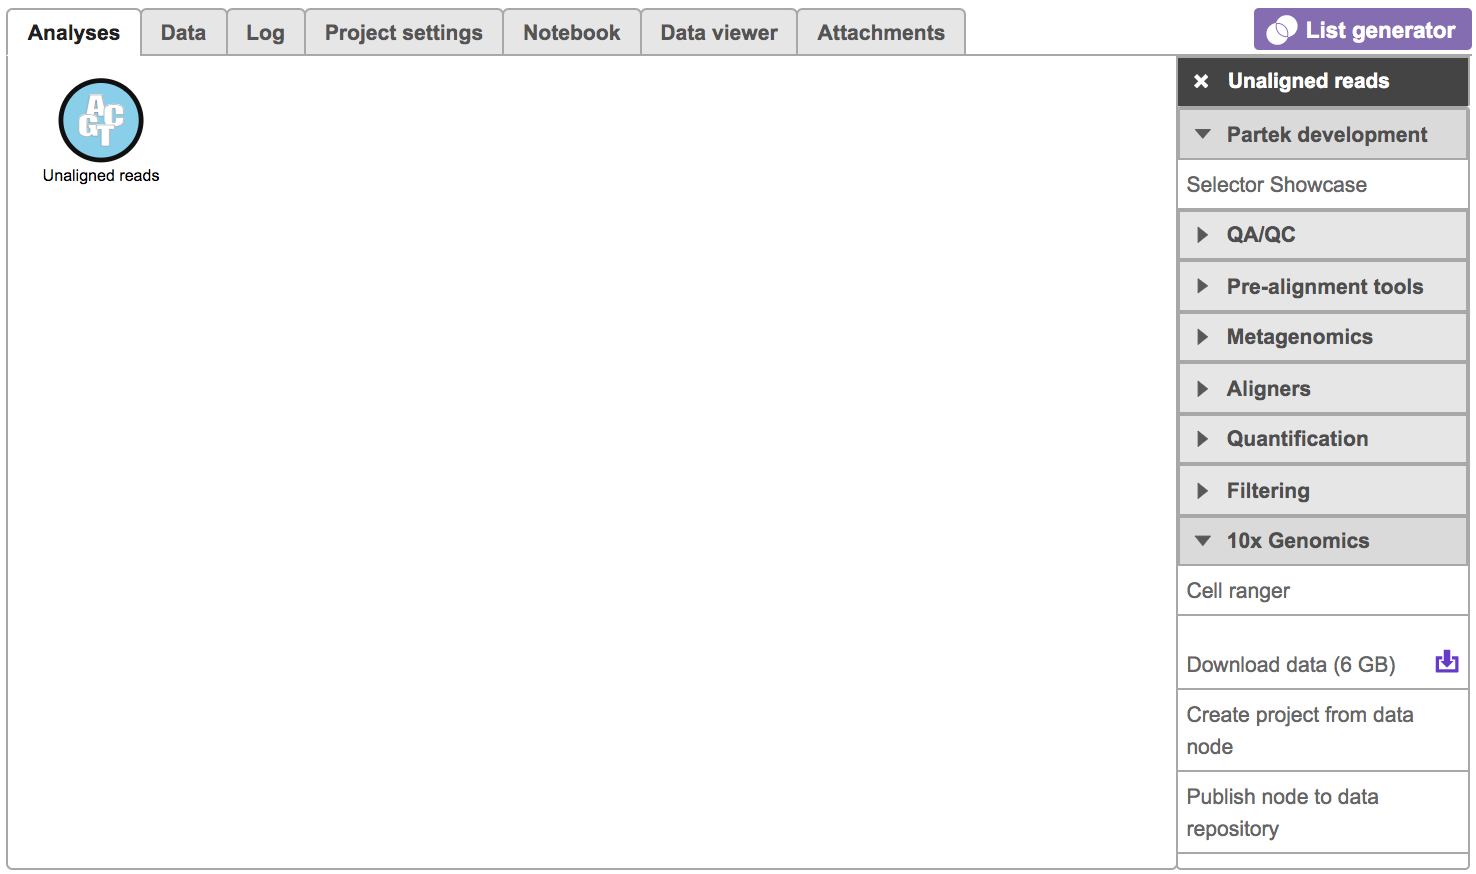
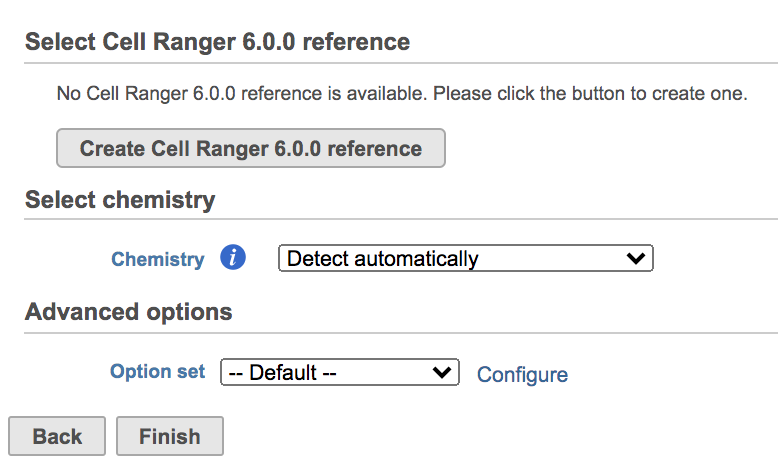
Users will be asked to create a Cell Ranger 6.0.0 reference genome if it is the first time to run the Cell ranger task in Flow (Figure 2).
| Numbered figure captions | ||||
|---|---|---|---|---|
| ||||
|
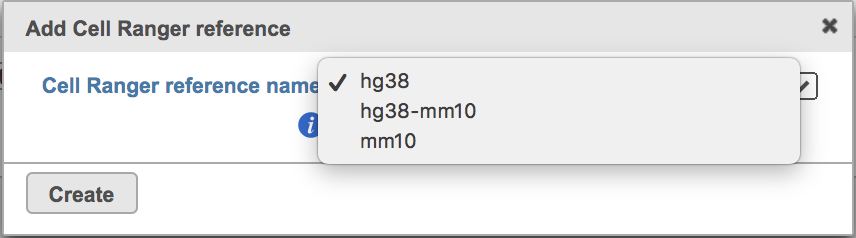
Clicking the big grey button of Create Cell Ranger 6.0.0 reference would pop up a new window where lists the three pre-built reference genomes for human(hg38), mouse(mm10) and the mix of two(hg38-mm10), respectively (Figure 3). They are exactly the same reference genomes (2020-A) that are provided in Cell Ranger by default. In details, the transcriptome annotations are respectively GENCODE v32 for human and vM23 for mouse, which are equivalent to Ensembl 98[3]. References for other organisms currently are not available in Flow Cell ranger, and will be coming in the future.
| Numbered figure captions | ||||
|---|---|---|---|---|
| ||||
|
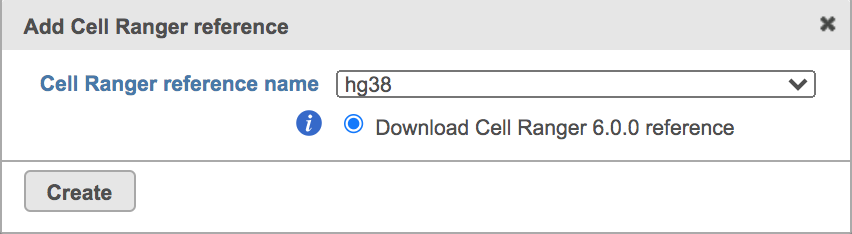
Once the right reference has been chosen, simply press the Create button to finish. The reference of ‘hg38’ has been selected as an example here (Figure 4).
| Numbered figure captions | ||||
|---|---|---|---|---|
| ||||
|
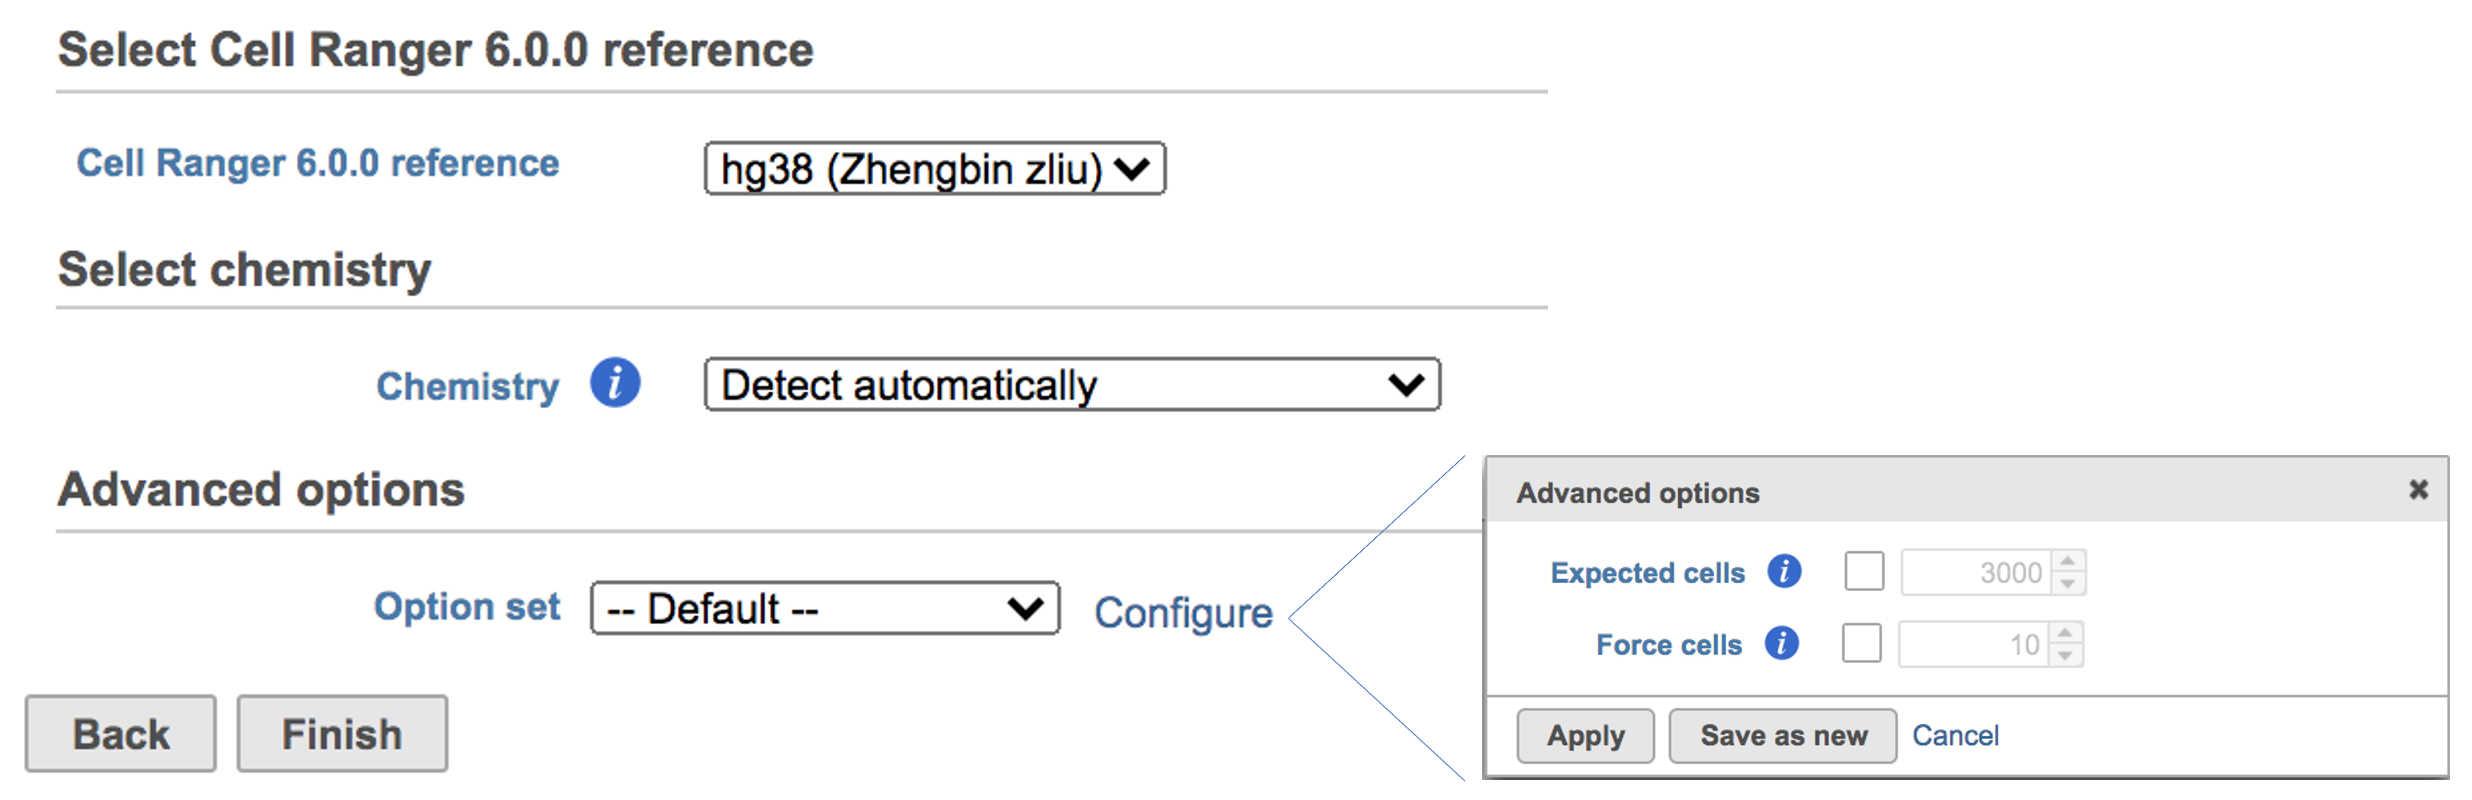
The main task menu will be refreshed as below (Figure 5) if references have been added. After the correct reference has been selected, users can go ahead click the Finish button to run the task as default.
| Numbered figure captions | ||||
|---|---|---|---|---|
| ||||
|
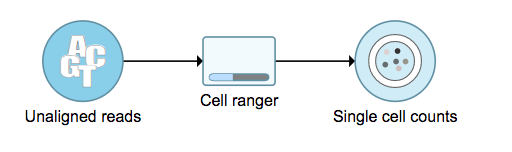
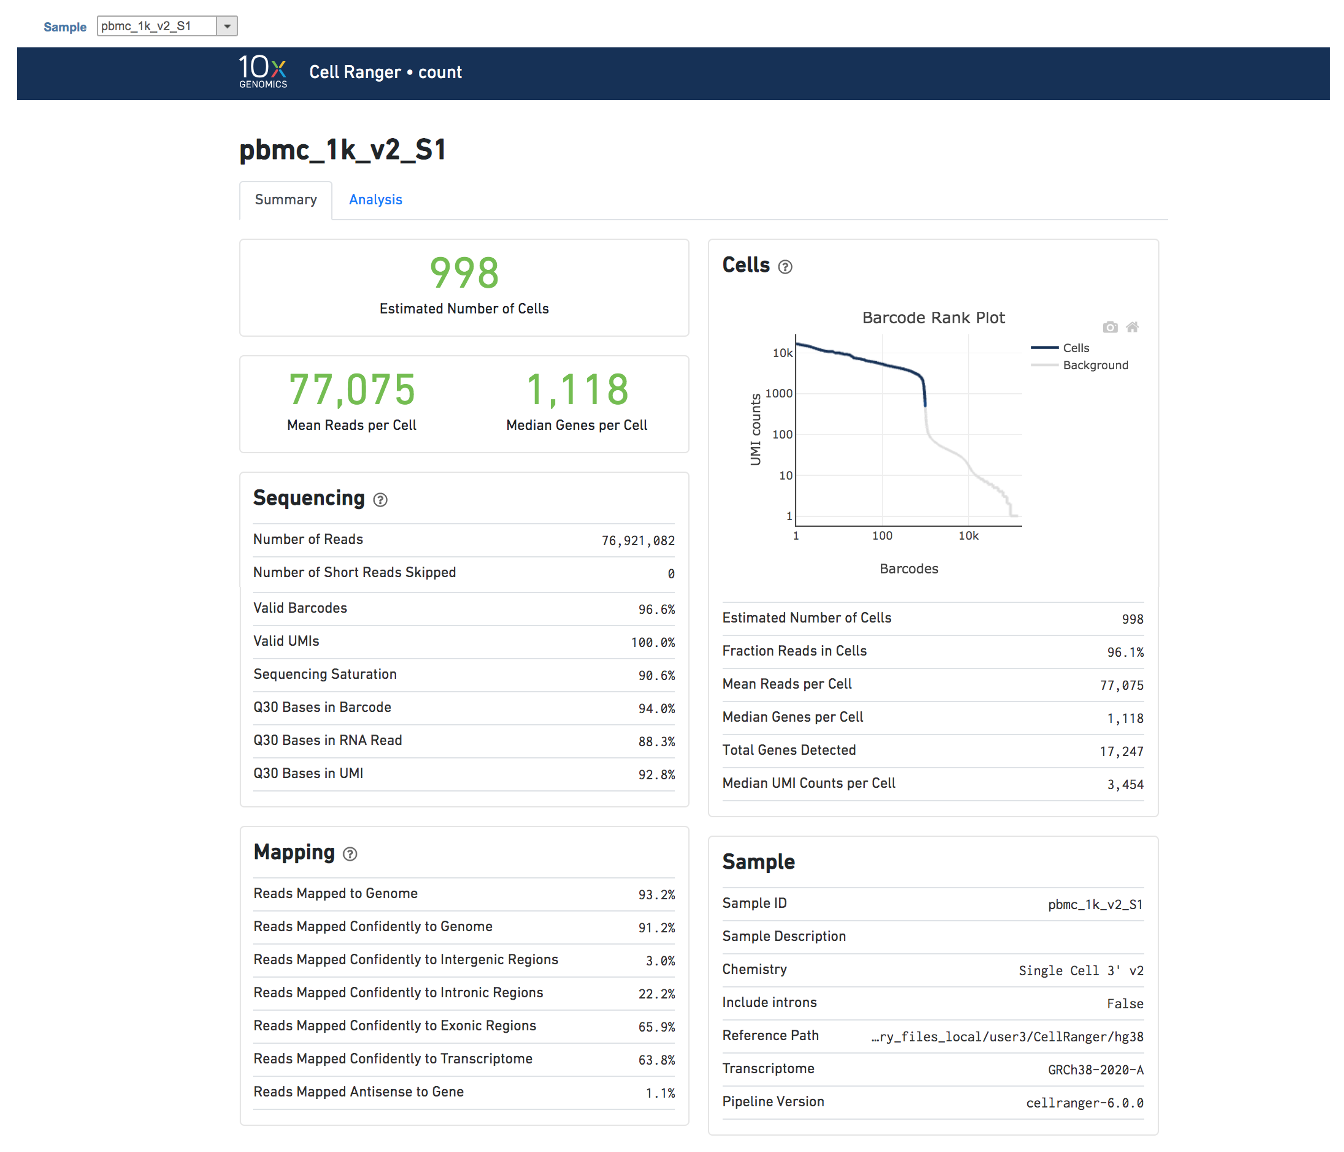
A new data node named ‘Single cell counts’ will be displayed in Flow if the task is running (Figure 6). This data node contains filtered feature barcode count matrix. To open the task report when the task is finished, double click the output data node, or select the ‘Task report’ in the section after single clicking the data node. Users then will find the task report (Figure 7) is the same to the ‘Summary HTML’ from Cell Ranger output.
| Numbered figure captions | ||||
|---|---|---|---|---|
| ||||
|
Cell ranger task report in Flow
...
| Numbered figure captions | ||||
|---|---|---|---|---|
| ||||
|
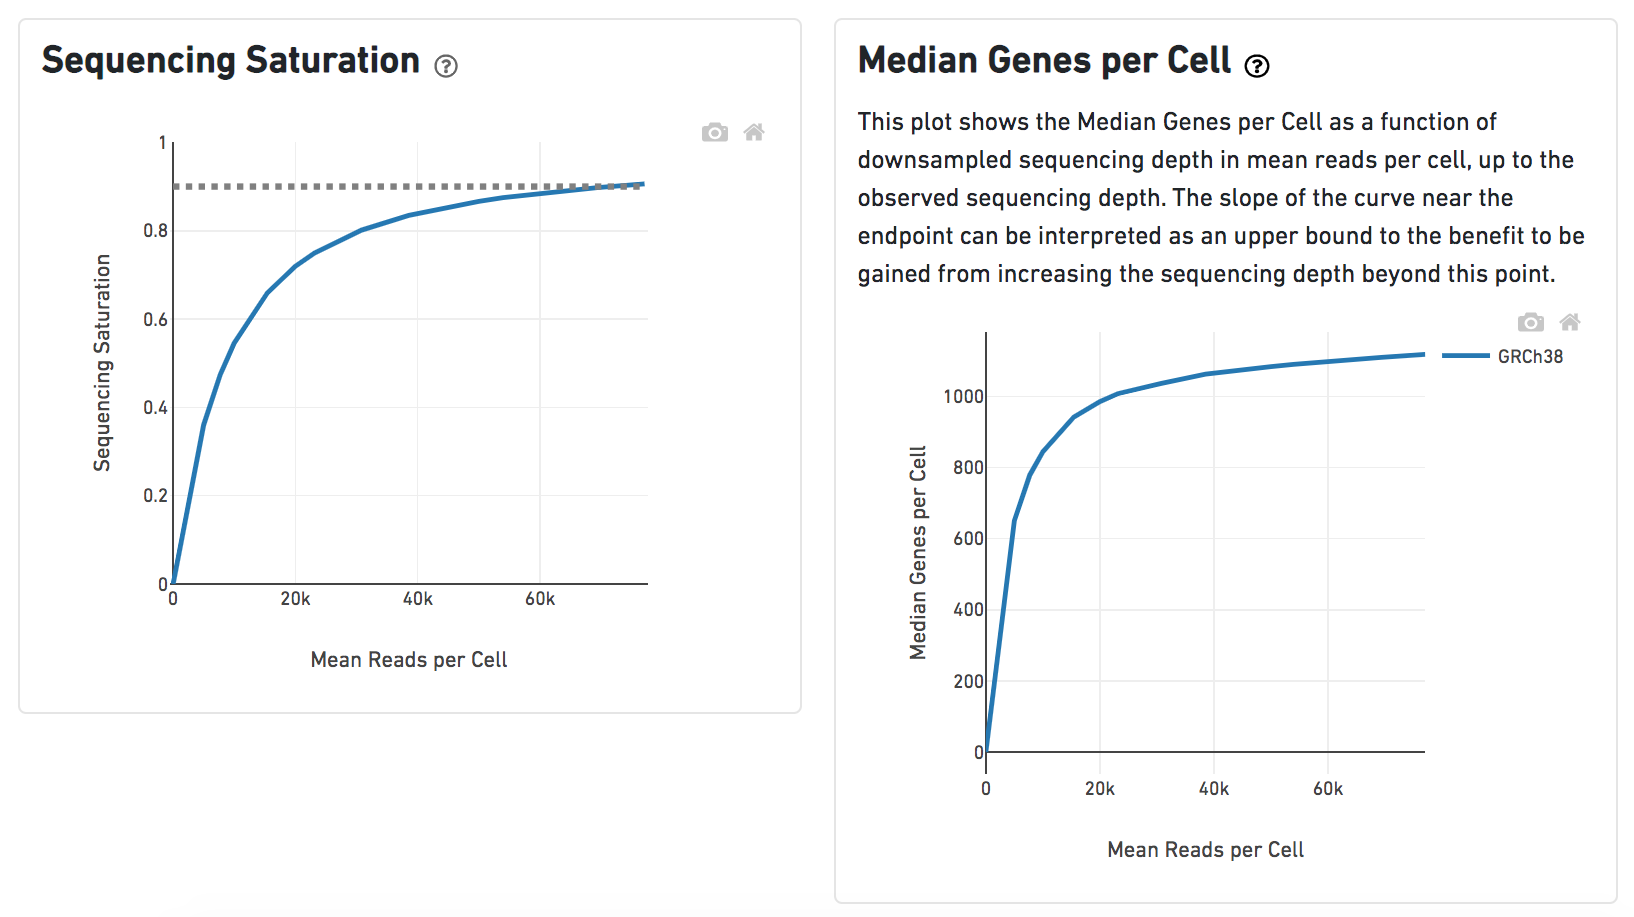
Another two plots -biplots of Sequencing Saturation and Median Genes per Cell to Mean Reads per Cell have been included in the Analysis report as they are important metrics to library complexity and sequencing depth (Figure 8).
| Numbered figure captions | ||||
|---|---|---|---|---|
| ||||
|
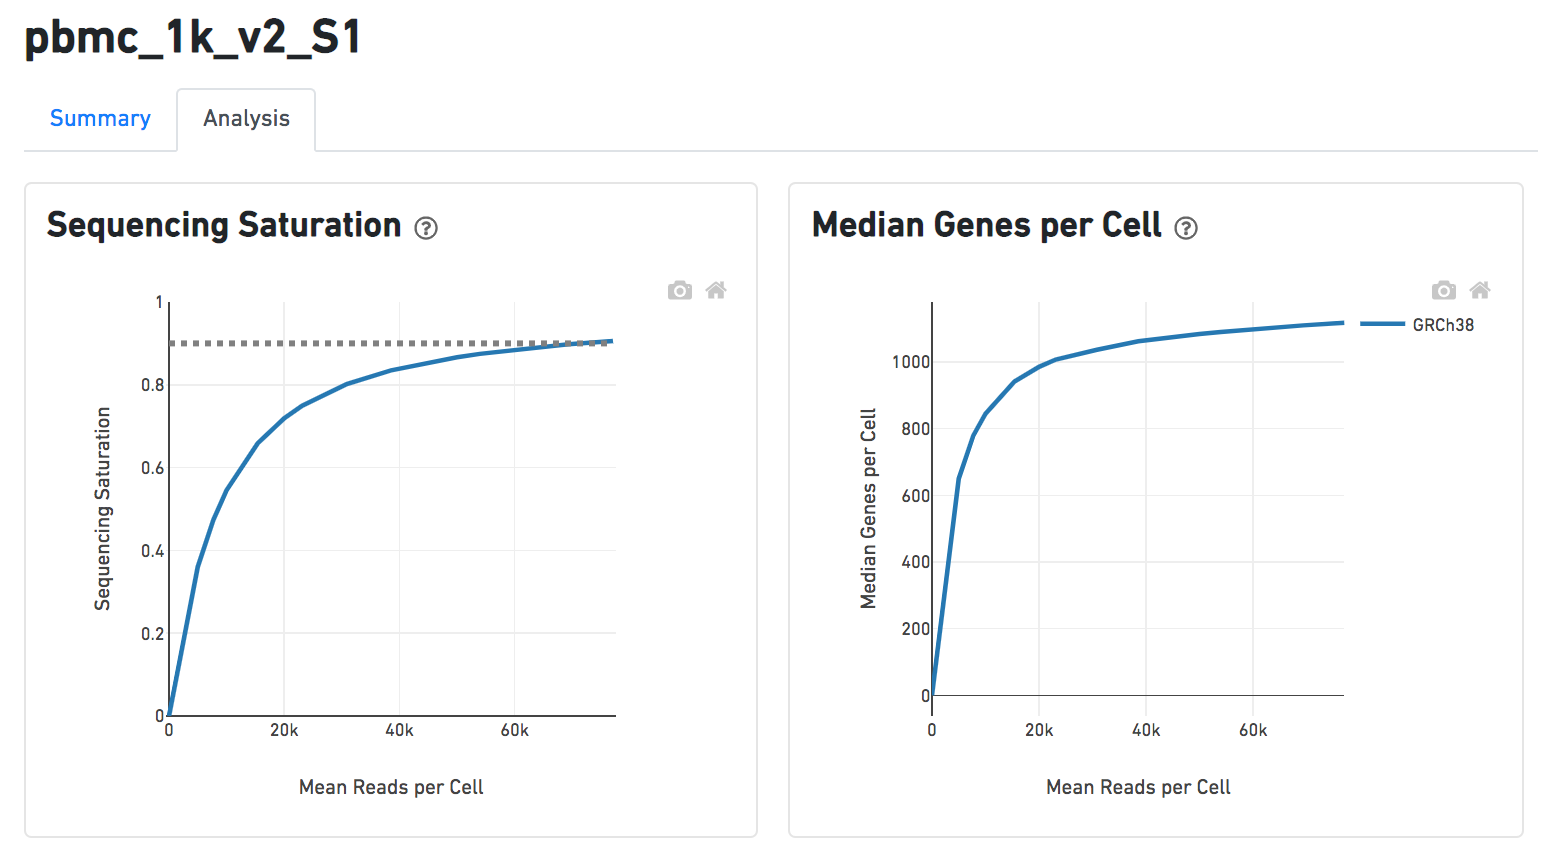
Details will be exhibited and the panel will be expanded correspondingly if the the ![]() icon is clicked. In the example below, the plot of Median Genes per Cell has been expanded while the Sequencing Saturation plot hasn't (Figure 9).
icon is clicked. In the example below, the plot of Median Genes per Cell has been expanded while the Sequencing Saturation plot hasn't (Figure 9).
| Numbered figure captions | ||||
|---|---|---|---|---|
| ||||
|
Users can click Configure to change the default settings In Advanced options (Figure 5).
...
Overview
Content Tools