Page History
...
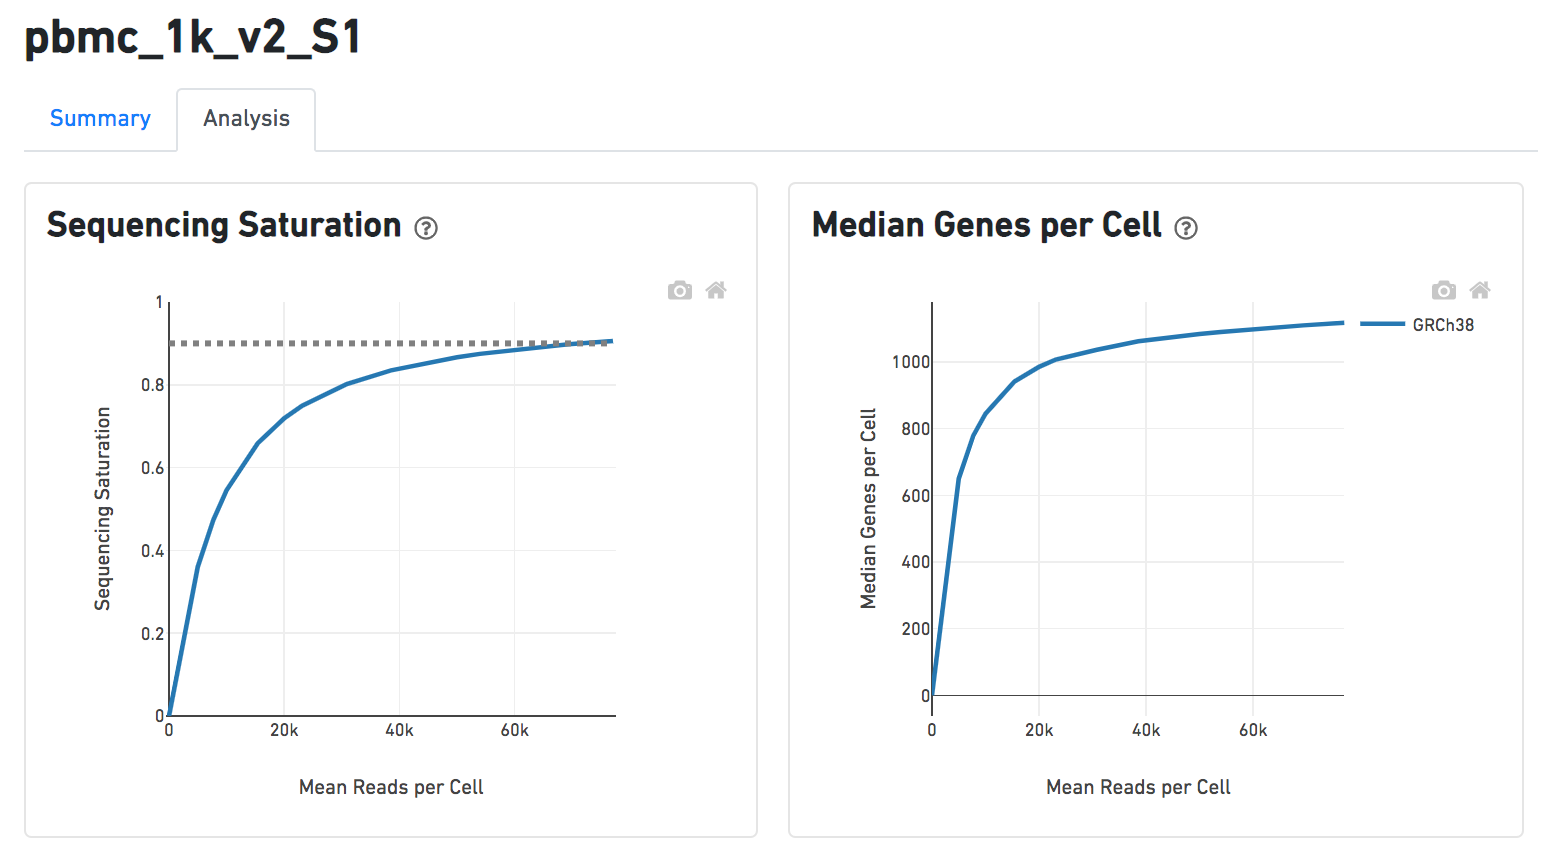
Another two plots -biplots of Sequencing Saturation and Median Genes per Cell to Mean Reads per Cells have Cell have been included on the Analysis report as they are important metrics to the library complexity and sequencing depth (Figure 8).
| Numbered figure captions | ||||
|---|---|---|---|---|
| ||||
|
A lot of details would details will be exhibited and the panel would will be expanded correspondingly if the the symbol![]() in the panel on each report has been clicked. In the example below, the plot of Median Genes per Cell has been expanded while the Sequencing Saturation plot hasn't (Figure 9).
in the panel on each report has been clicked. In the example below, the plot of Median Genes per Cell has been expanded while the Sequencing Saturation plot hasn't (Figure 9).
...
Overview
Content Tools