Page History
...
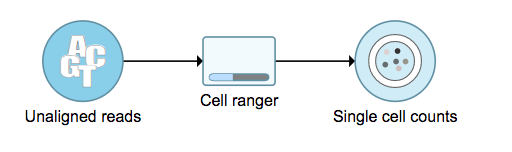
A new data node named ‘Single cell counts’ will be displayed in Flow if the task is running (Figure 6). To open the task report, simply double click the output data node, or select the ‘Task report’ in the section after clicking the data node after the tasking running is finished. User Users then will find the task report (Figure 7) is the same to the ‘Summary HTML’ from Cell Ranger output.
| Numbered figure captions | ||||
|---|---|---|---|---|
| ||||
|
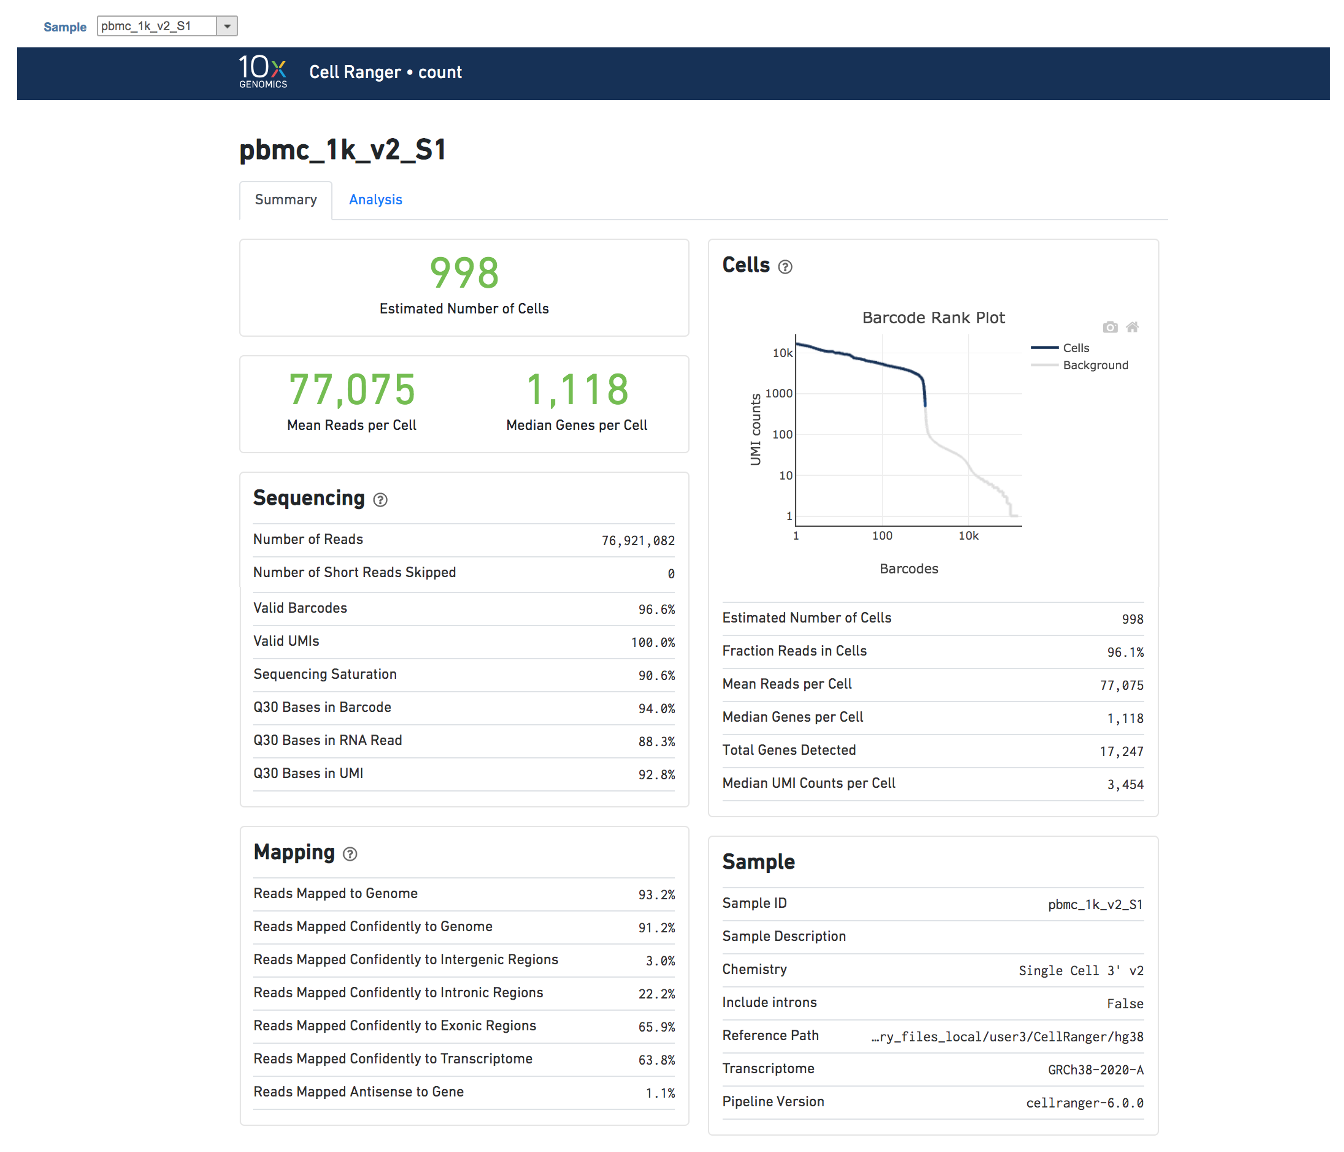
Task report is sample based. Users can use the dropdown list on the top left to switch samples. There are two tabs on each report - Summary report and Analysis report (Figure 7). Important information on Estimated Number of Cells, Mean Reads per Cell, Median Genes per Cell, as well as information on Sequencing, Mapping, and Sample are summarized in different panels. The Barcode Rank Plot has also been included as an important piece in the Cells panel in the report.
| Numbered figure captions | ||||
|---|---|---|---|---|
| ||||
|
References
https://support.10xgenomics.com/single-cell-gene-expression/software/overview/welcome
https://support.10xgenomics.com/single-cell-gene-expression/software/pipelines/6.0/release-notes
- https://support.10xgenomics.com/single-cell-gene-expression/software/pipelines/4.0/release-notes
...
Overview
Content Tools