Page History
| Table of Contents | ||||||
|---|---|---|---|---|---|---|
|
Overview of Trajectory Analysis
Cells undergo changes to transition from one state to another as part of development, disease, and throughout life. Since those changes can be gradual, trajectory analysis attempts to describe progress through a biological process as a position along a path. Because biological processes are often complex, trajectory analysis builds branching trajectories where different paths can be chosen at different points along the trajectory. The progress of a cell along a trajectory from the starting point or root, can be quantified as a numeric value, pseudotime.
In Partek Flow, we use tools from Monocle 3 (1) to build trajectories, identify states and branch points, and calculate pseudotime values. The output of Trajectory analysis task includes an interactive 2D/3D visualization for viewing the trajectory trees and setting the root states (starting points of the trajectories). From the Trajectory analysis report, you can run a second task, Calculate pseudotime, which adds a numeric cell-level attribute, Pseudotime, calculated using the chosen root states.
Prerequisites for the Analysis
Trajectory analysis by Monocle 3 requires data normalization and preprocessing. Regarding the normalization, we suggest to first use the Normalization and scaling section of the toolbox to normalize by counts per million (CPM), and add offset of 1. After that, launch the Trajectory analysis on the Normalized counts node.
According to the Monocle 3 authors, you may want to filter in the top 5,000 genes with the highest variance (2,000 genes for datasets with fewer than 5,000 cells, and 300 genes for datasets with fewer than 1,000 cells) (1). Those number should be used as a guidance for the first-pass analysis and may need to be optimized, depending on the project at hand and the biological question.
Setting up Trajectory Analysis
To run Trajectory analysis tool, select the Normalized counts data node (or equivalent) and go to the toolbox: Exploratory analysis > Trajectory analysis
...
Under the hood, Monocle 3 will perform log2 transformation of the gene count matrix (if Data is logged was unselected), scale the matrix (if Scaling was selected), and project the gene count matrix into the top 50 principal components. Next, the dimensionality reduction will be implemented by UMAP (using default settings of the reduce_dimension command).
Trajectory Analysis Result
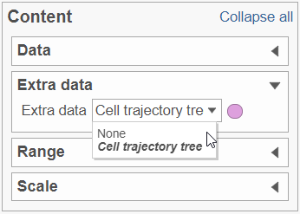
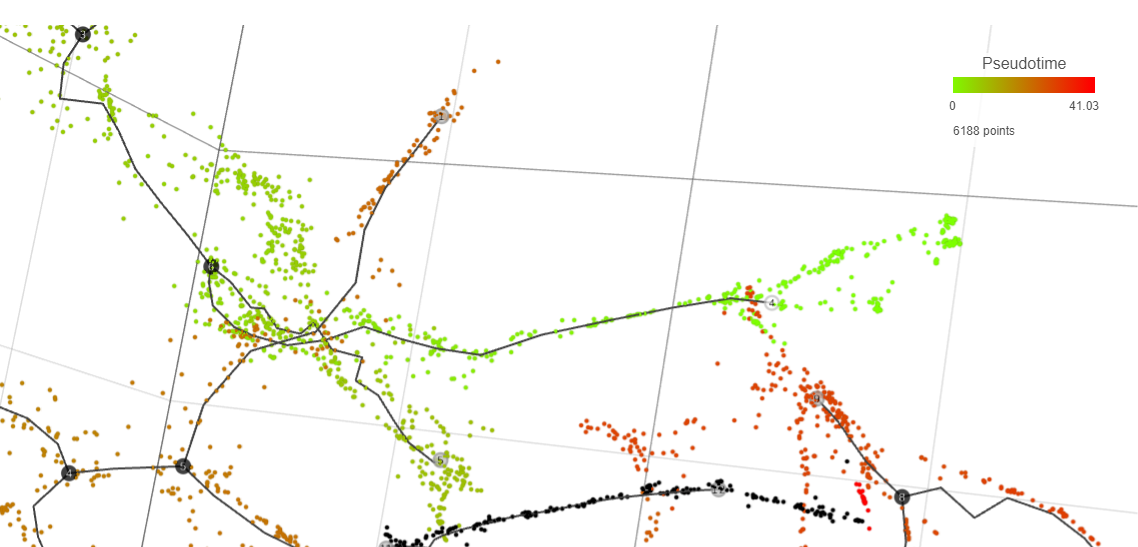
Result of running Trajectory analysis in Partek Flow is the Trajectory result data node. Double clicking on the node opens a Data Viewer window with the trajectory plot (Figure 1). Cell trajectory graph shows position of each cell (blue dot) with respect to the UMAP coordinates (axes). Cell trajectories (one or more, depending on the data set) are depicted as black lines. Gray circles are trajectory nodes (i.e. cell communities).
...
| Numbered figure captions | ||||
|---|---|---|---|---|
| ||||
|
Pseudotime Analysis
To perform pseudotime analysis, you need to point to the cells at the beginning of the biological process you are interested in. For example, cells at the earliest stage of differentiation sequence. There are two ways to perform pseudotime analysis in Partek Flow, depending on the way the root nodes (=cells at the beginning of pseudotime) are defined.
- Manual selection of root node. The user has to specify the root nodes (one or more).
- Automatic selection of the root node. The root nodes are picked by the algorithm.
Manual Selection of the Root Node
If you want to manually pick the root nodes, leave the option Programmatically calculate default root nodes unselected.
...
| Numbered figure captions | ||||
|---|---|---|---|---|
| ||||
|
Automatic Selection of the Root Node
If suitable meta-data are available, it is possible to automatically select the root node. For example, you may know which cells were harvested from the earliest time points. The cells need to be annotated by that information (Annotate Cells task) before running Trajectory Analysis. The annotation will, in turn, be available in the Trajectory analysis setup dialog, upon selecting the Programmatically calculate default root nodes option (Figure xx).
...
| Numbered figure captions | ||||
|---|---|---|---|---|
| ||||
|

Difference Between Monocle 3 and Monocle 2
Major updates in Monocle 3 (compared to Monocle 2) include:
- Monocle 3 learns the principal trajectory graph in the UMAP space;
- the principal graph is smoothened and small branches are excluded;
- support for principal graphs with loops and convergence points;
- support for multiple root nodes.
References
- Cao J, Spielmann M, Qiu X, Huang X, Ibrahim DM, Hill AJ, Zhang F, Mundlos S, Christiansen L, Steemers FJ, Trapnell C, Shendure J. The single-cell transcriptional landscape of mammalian organogenesis. Nature. 2019 Feb;566(7745):496-502. doi: 10.1038/s41586-019-0969-x. Epub 2019 Feb 20. PMID: 30787437; PMCID: PMC6434952.
...
Overview
Content Tools