Page History
...
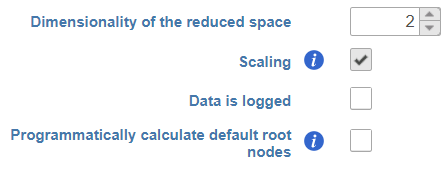
These configuration dialog presents four options (Figure 1).
- Dimensionality of reduced space. This option specifies the number of UMAP dimensions that the original data are reduced to, in order to learn the trajectory tree (dimensionality of original data equals the number of genes). Default is two, meaning that the trajectory plot will be draw in two dimensions. To get a 3D trajectory plot, increase this option to 3.
- Scaling. Normalized expression values can be further transformed by scaling to unit variance and zero mean (i.e. converting to Z score). The use of this option is recommended (1).
- Data is logged. Select this option if the data have already been log-transformed upstream. When selected, Monocle 3 will skip the log2 step on the input data (see below).
- Programmatically calculate default root nodes. If not selected, user has to specify the root nodes of the trajectory tree manually (default). Depending on the available meta-data, Monocle 3 may be able to pick the root nodes programmatically (see below for details)
...
| Numbered figure captions | ||||
|---|---|---|---|---|
| ||||
Under the hood, Monocle 3 will perform log2 transformation of the gene count matrix (if Data is logged was unselected), scale the matrix (if Scaling was selected), and project the gene count matrix into the top 50 principal components. Next, the dimensionality reduction will be implemented by UMAP (using default settings of the reduce_dimension command).
...
To perform pseudotime analysis, you need to point to the cells at the beginning of the biological process you are interested in. For example, cells at the earliest stage of differentiation sequence. There are two ways to perform pseudotime analysis in Partek Flow, depending on the way the root nodes node (=cells at the beginning of ) are is defined.
- Manual selection of root node. The user has to specify the root nodes (one or more).
- Automatic selection of the root node. The root nodes are node is picked by the algorithm.
Manual Selection of the Root Node
...
| Numbered figure captions | ||||
|---|---|---|---|---|
| ||||
Automatic Selection of the Root Node
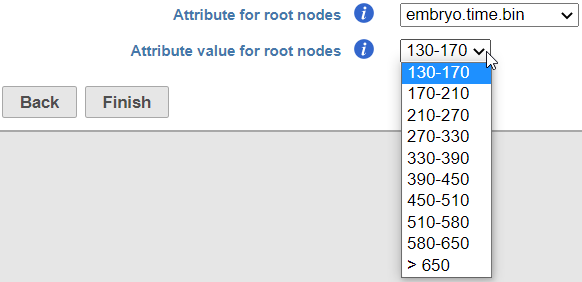
If suitable meta-data are available, it is possible to automatically select the root node. For example, you may know which cells were harvested from the earliest time points. The cells need to be annotated by that information (Annotate Cells task) before running Trajectory Analysis. The annotation will, in turn, be available in the Trajectory analysis setup dialog, upon selecting the Programmatically calculate default root nodes option (Figure xx).
| Numbered figure captions | ||||
|---|---|---|---|---|
| ||||
If selected, Monocle 3 will first group the cells according to which trajectory node they are nearest to. It then calculates the fraction of the cells from the earliest time point at each trajectory node. Finally, it picks the node with the highest prevalence of the early cells and treats it as the root node.
...


