Page History
...
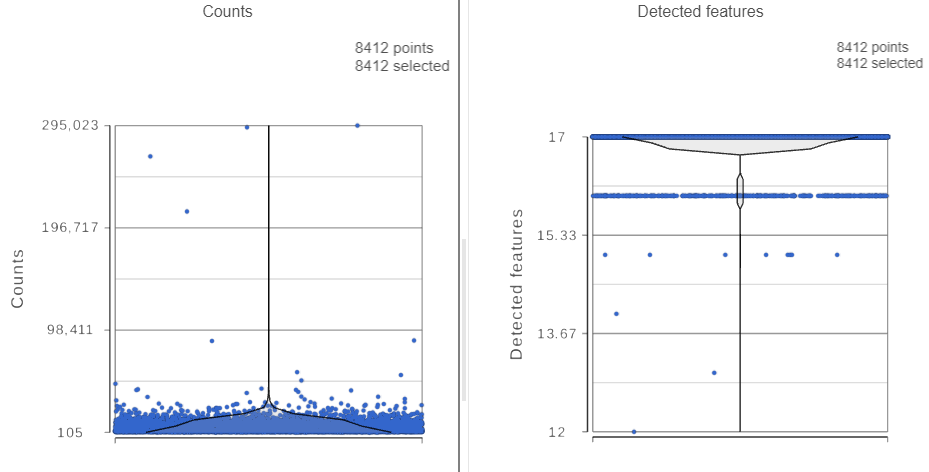
The Single cell QA/QC report opens in a new data viewer session. There are interactive violin plots showing the most commonly used quality metrics for each cell (Figure 3). For this data set, there are two relevant plots: the : the total count per cell and the number of detected features per cell. Each cell (Figure 3). Each point on the plots is a cell and the violins illustrate the distribution of values for the y-axis metric. Because mitochondrial transcripts are not present in protein data, this plot is not informative for this data set.
- Remove the % mitochondrial counts and the extra text box in the bottom right by clicking Remove plot in the top right corner of each plot (Figure 3)
| Numbered figure captions | ||||
|---|---|---|---|---|
| ||||
|
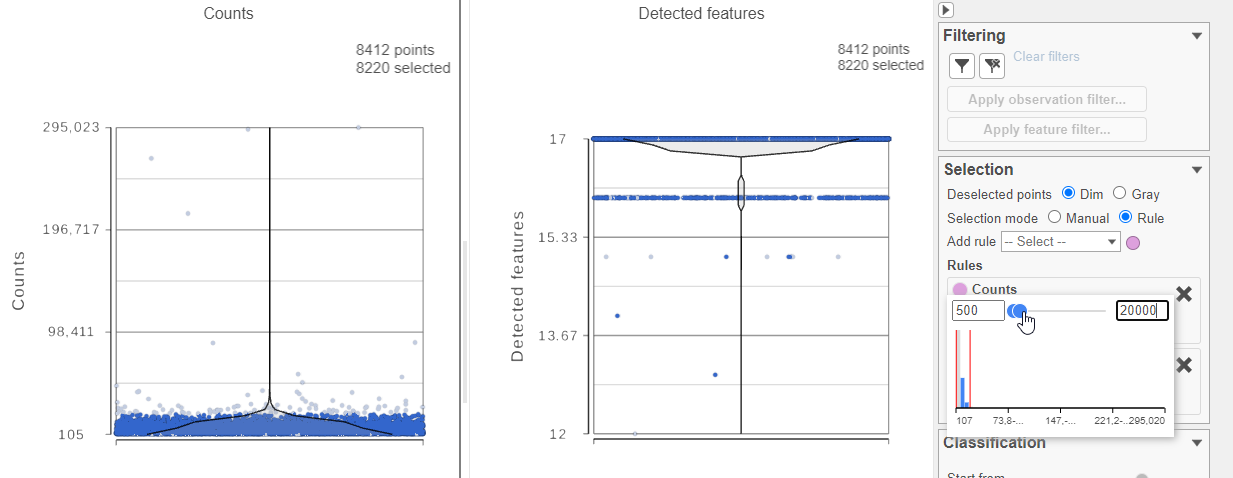
For this analysis, we will set a maximum counts threshold to exclude potential protein aggregates and, because we expect every cell to be bound by several antibodies, we will also set a minimum counts threshold.
...
| Numbered figure captions | ||||
|---|---|---|---|---|
| ||||
|
- Click
 in the Filtering card on the right
 - Click Apply observation filter...
- Select the Antibody Capture data node as input in the pipeline preview (Figure 5)
- Click Select
...
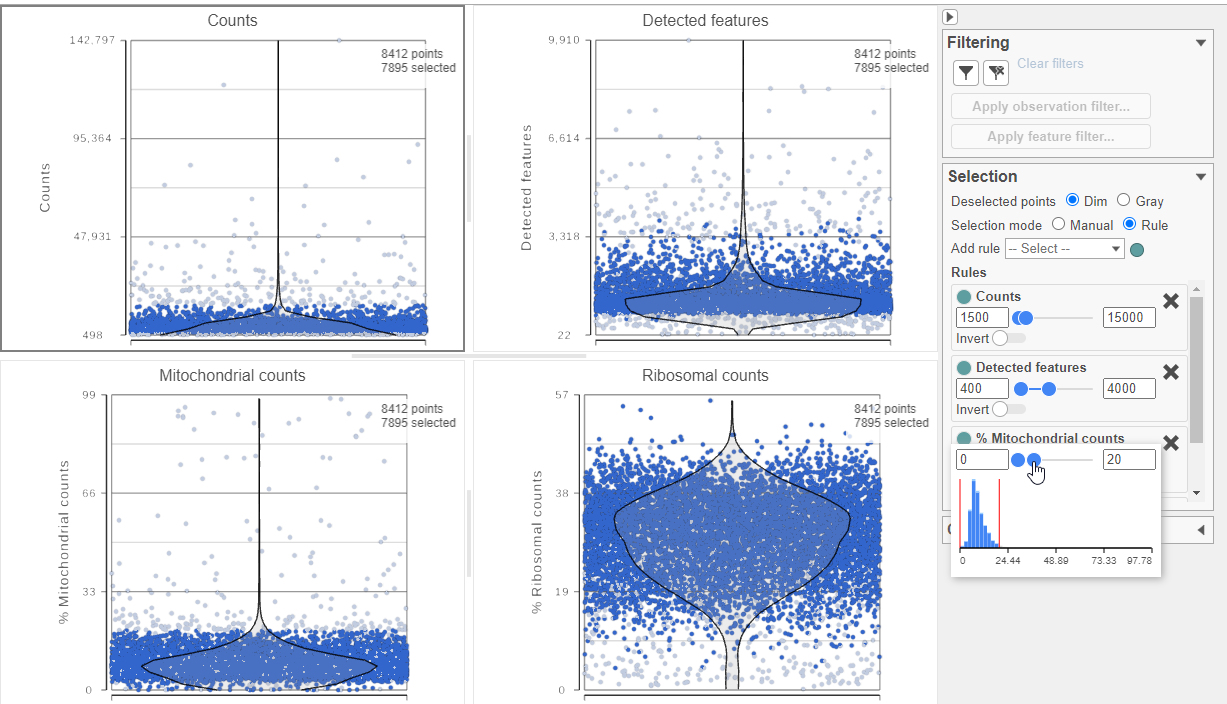
The task report lists the number of counts per cell, the number of detected features per cell, and the percentage of mitochondrial reads per cell in three , and the percentage of ribosomal counts per cell in four violin plots (Figure 6). For this analysis, we will set maximum and minimum thresholds for total counts and detected genes to exclude potential doublets and a maximum mitochondrial reads percentage filter to exclude potential dead or dying cells. There is no need to apply a filter based on the percentage of ribosomal counts in this tutorial.
- In the Selection card on the right, set the Counts threshold to keep cells between 1500 and 15000
- Set the Detected features to keep cells between 400 and 4000
- Set the % Mitochondrial counts to keep cells between 0% and 20% (Figure 6)
...
| Numbered figure captions | ||||
|---|---|---|---|---|
| ||||
|
- Click in the Filtering card on the right
- Click Apply observations filter
- Select the Gene Expression data node as input in the pipeline preview
- Click Select
- Click OK to dismiss the message about the task being enqueued
- Click the project name at the top to go back to the Analyses tab
- Your browser may warn you that any unsaved changes to the data viewer session will be lost. Ignore this message and proceed to the Analyses tab
...
Overview
Content Tools