Skip to content
Skip to breadcrumbs
Skip to header menu
Skip to action menu
Skip to quick search
Spaces
Hit enter to search
Help
Online Help
Keyboard Shortcuts
Feed Builder
What’s new
Available Gadgets
About Confluence
Log in
Flow Documentation
Partek Flow Documentation
Page tree
Browse pages
Configure
Space tools
View Page
Page History
Page Information
View in Hierarchy
View Source
Export to PDF
Pages
…
Partek Flow Documentation
User Manual
Task Menu
Trajectory Analysis
Trajectory Analysis (Monocle 3)
Page History
Versions Compared
Old Version
3
changes.mady.by.user
Ivan Lukic
Saved on
Feb 26, 2021
compared with
New Version
4
changes.mady.by.user
Ivan Lukic
Saved on
Feb 26, 2021
Previous Change: Difference between versions 2 and 3
Next Change: Difference between versions 4 and 5
View Page History
Key
This line was added.
This line was removed.
Formatting was changed.
...
Numbered figure captions
SubtitleText
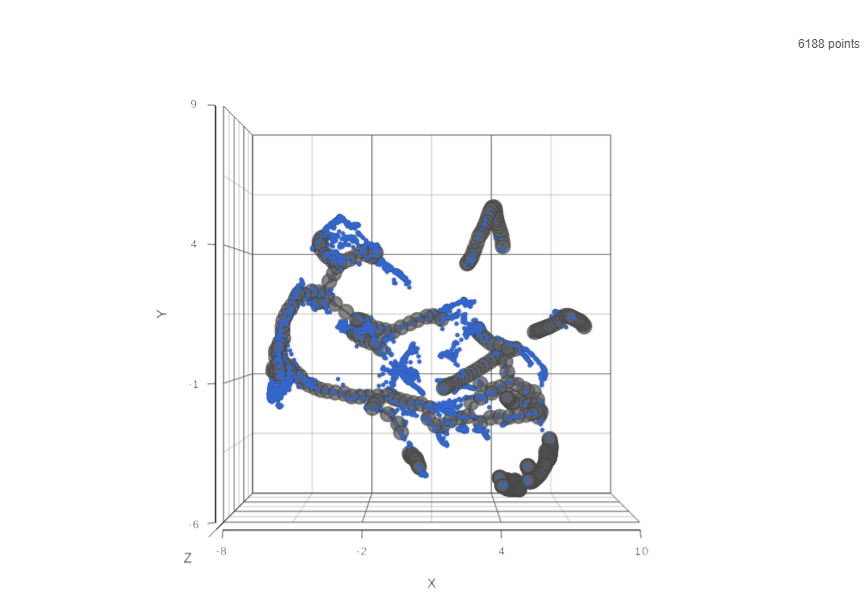
Cell trajectory graph. Blue dots are individual cells (total count is displayed in the upper right). Black line represents the structure of the trajectory graph. Gray circles are nodes or leaves. The axes represent UMAP coordinates.
AnchorName
3D trajectory plot
Image Added
Additional assistance
Rate Macro
allowUsers
false
...
Overview
Content Tools
{"serverDuration": 65, "requestCorrelationId": "619e2e8197c94bc3"}