Page History
...
| Numbered figure captions | ||||
|---|---|---|---|---|
| ||||
|

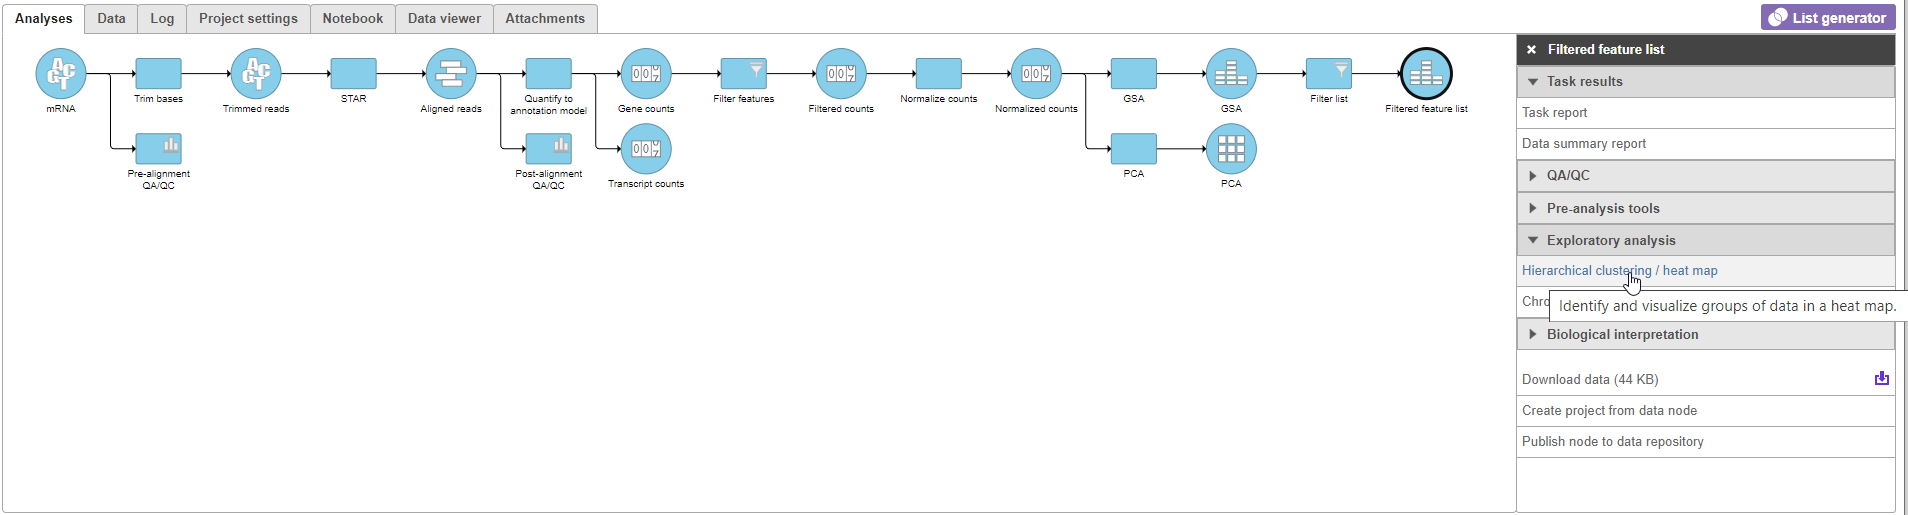
The Hierarchical clustering menu will open (Figure 2).
| Numbered figure captions | ||||
|---|---|---|---|---|
| ||||
|


- Click Finish to run with default settings
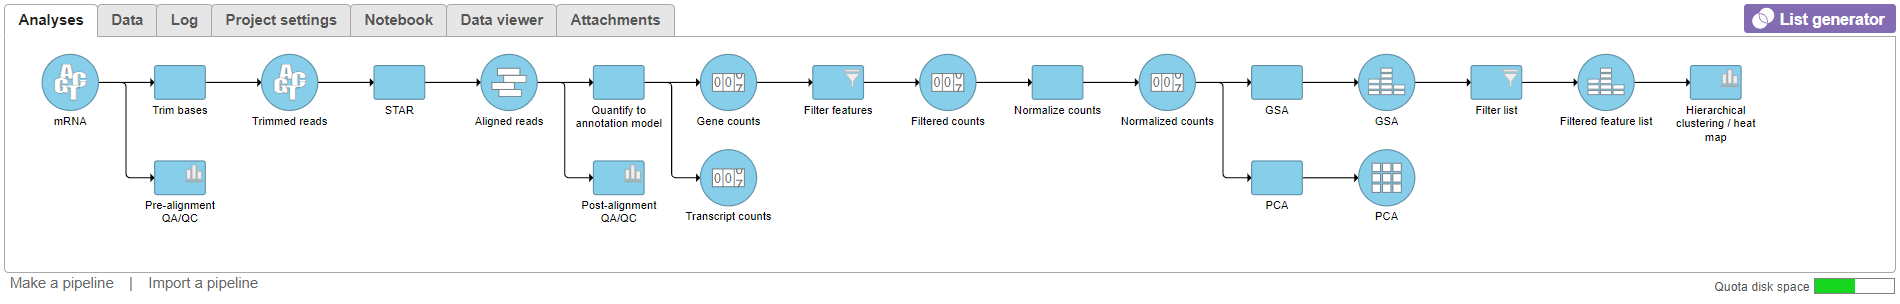
A Hierarchical clustering task node will be added to the pipeline (Figure 3).
| Numbered figure captions | ||||
|---|---|---|---|---|
| ||||
|

- Double-click the Hierarchical clustering clustering / heat map task node to launch the heat map
The Dendrogram view will open showing a heat map with the hierarchical clustering results (Figure 4).
| Numbered figure captions | ||||
|---|---|---|---|---|
| ||||
|

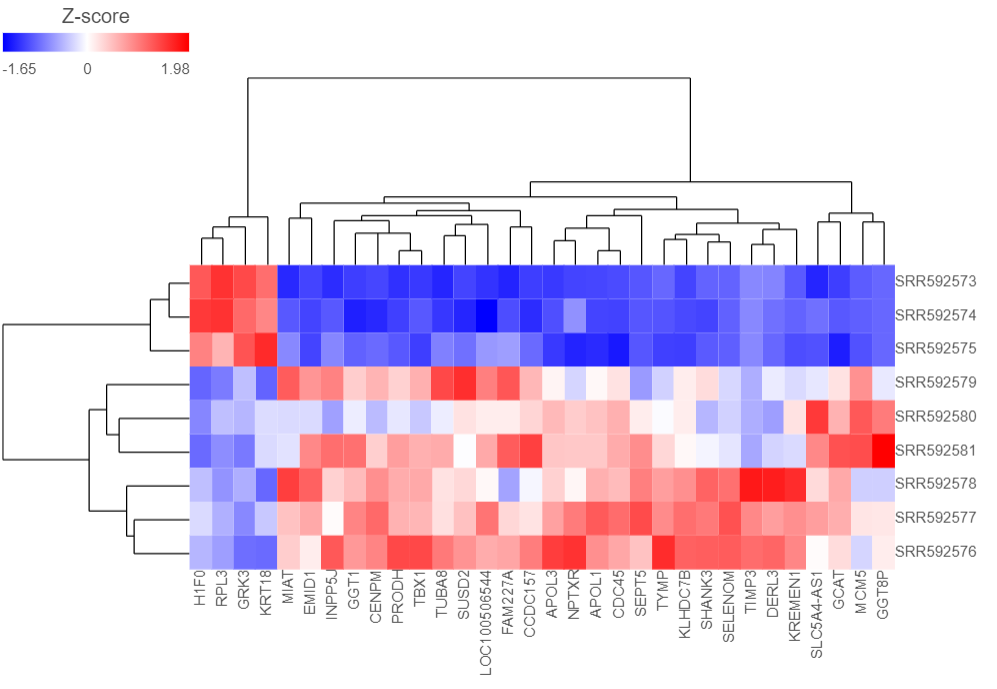
Samples are shown on rows and genes on columns. Clustering for samples and genes is shown through the dendrogram trees. More similar samples/genes are separated by fewer branch points of the dendrogram tree.
...
The heat map can be customized to improve data visualization using the menu on the left- Configuration panel on the left.
- Expand the Annotations > Data card.
- Click on the gray button
 on the right hand side of
...
- Select 5-AZA Dose from the Attributes drop-down menuRow annot None available
- In the dialog, click on the Gene counts node
- Now set the Row annot to 5-AZA Doze
Samples are now labeled with their Treatment 5-AZA Doze group (Figure 5).
| Numbered figure captions | ||||
|---|---|---|---|---|
| ||||
|

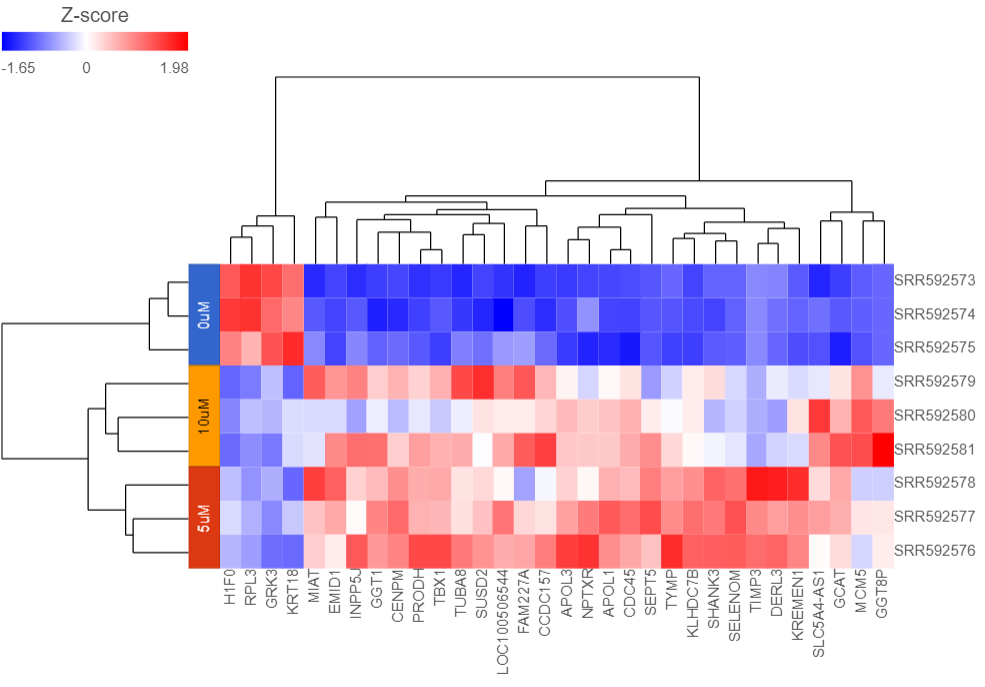
Samples cluster based on treatment group and the 5μM and 10μM groups are more similar to each other than to the 0μM group.
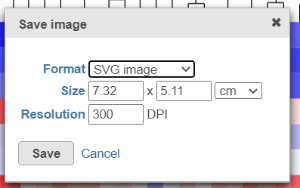
We can save the heat map as a publication-quality image.
- Click
 Click the Save image icon
  in the top right corner of the plot
 - Choose size and resolution using the Save as SVG dialog (Figure 6)
| Numbered figure captions | ||||
|---|---|---|---|---|
| ||||
|

- Select Save
The heat map will be saved as a .svg file and downloaded in your web browser.
For more information about hierarchical clustering and the Dendrogram view, please see the Hierarchical Clustering (Old Version) user guide.
| Page Turner | ||
|---|---|---|
|
| Additional assistance |
|---|
| Rate Macro | ||
|---|---|---|
|
...
Overview
Content Tools