Page History
...
| Numbered figure captions | ||||
|---|---|---|---|---|
| ||||
|
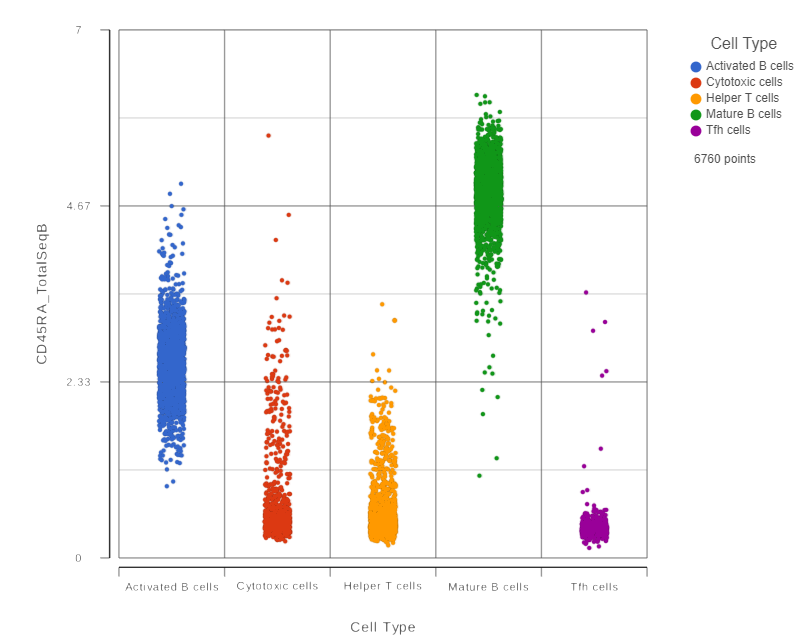
We can use the Configuration panel on the left to edit this plot.
...
| Numbered figure captions | ||||
|---|---|---|---|---|
| ||||
|
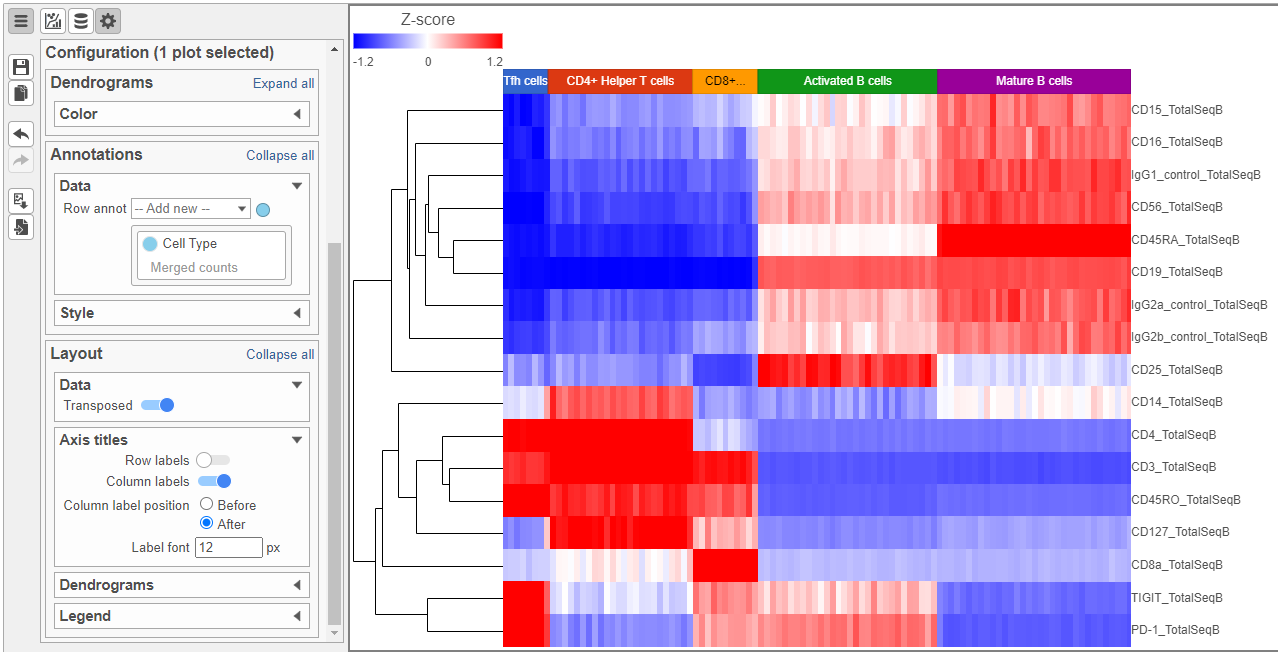
Differential Analysis, Visualization, and Pathway analysis - Gene Expression Data
...
| Numbered figure captions | ||||
|---|---|---|---|---|
| ||||
|
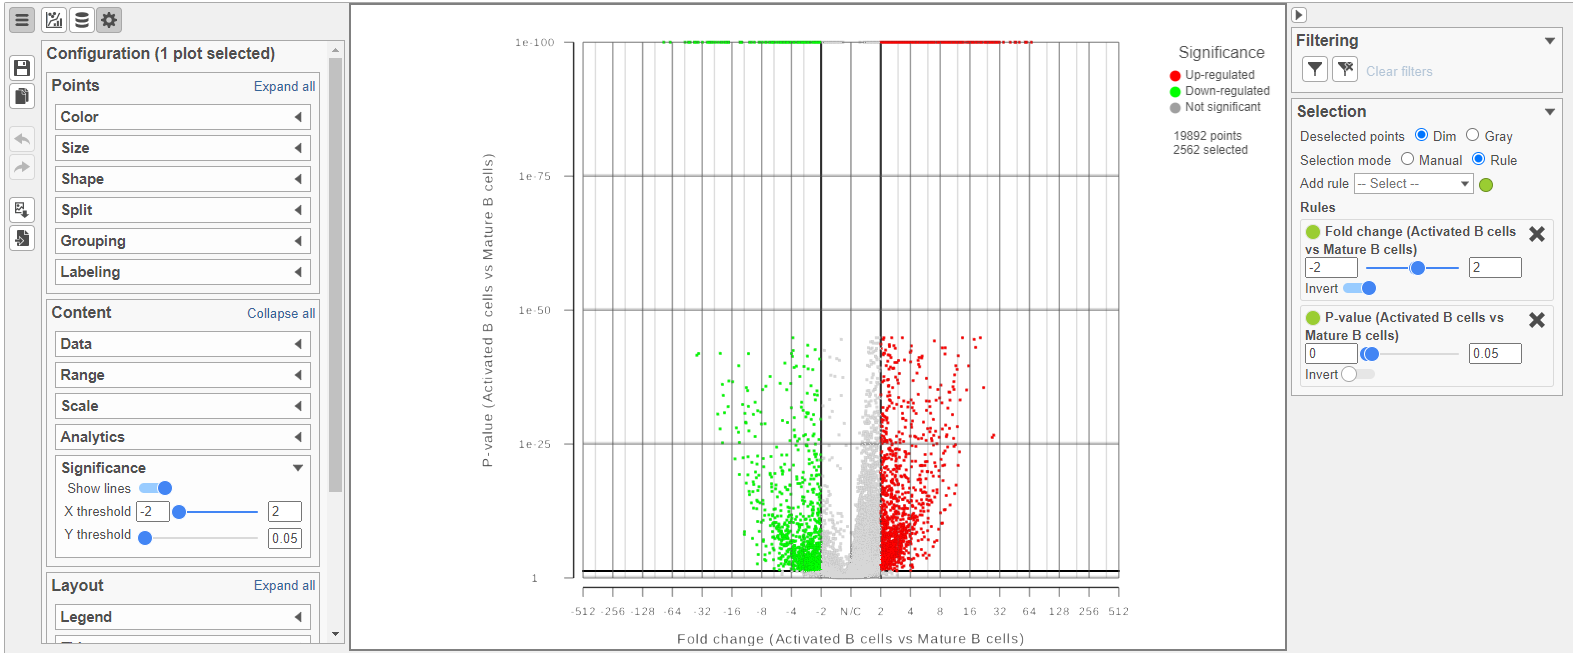
Because more than 20,000 genes have been analyzed, it is useful to use a volcano plot to get an idea about the overall changes.
...
| Numbered figure captions | ||||
|---|---|---|---|---|
| ||||
|
- Click the GSA report tab in your web browser to return to the full report
...
| Numbered figure captions | ||||
|---|---|---|---|---|
| ||||
|
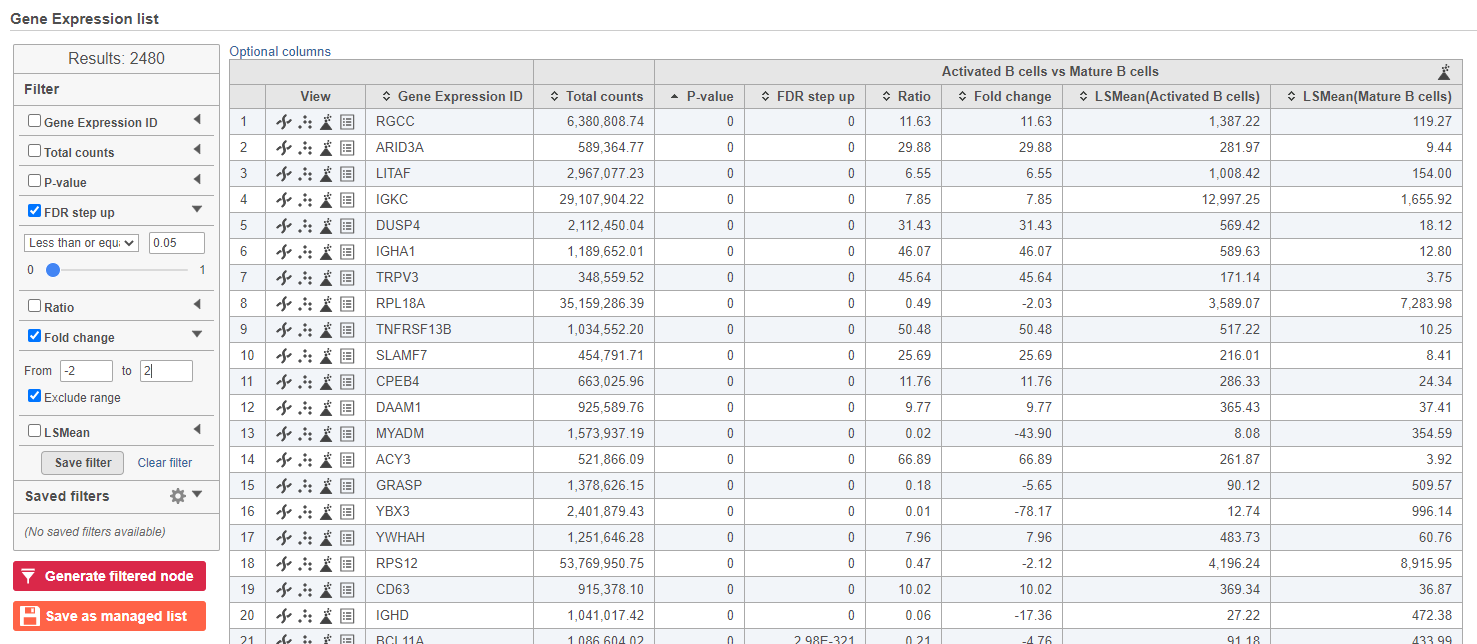
- Click
to create a new data node including only these significantly different genes
...
Overview
Content Tools