...
| Numbered figure captions |
|---|
| SubtitleText | Heatmap showing expression of protein markers after configuration |
|---|
| AnchorName | Heatmap of proteins configured |
|---|
|
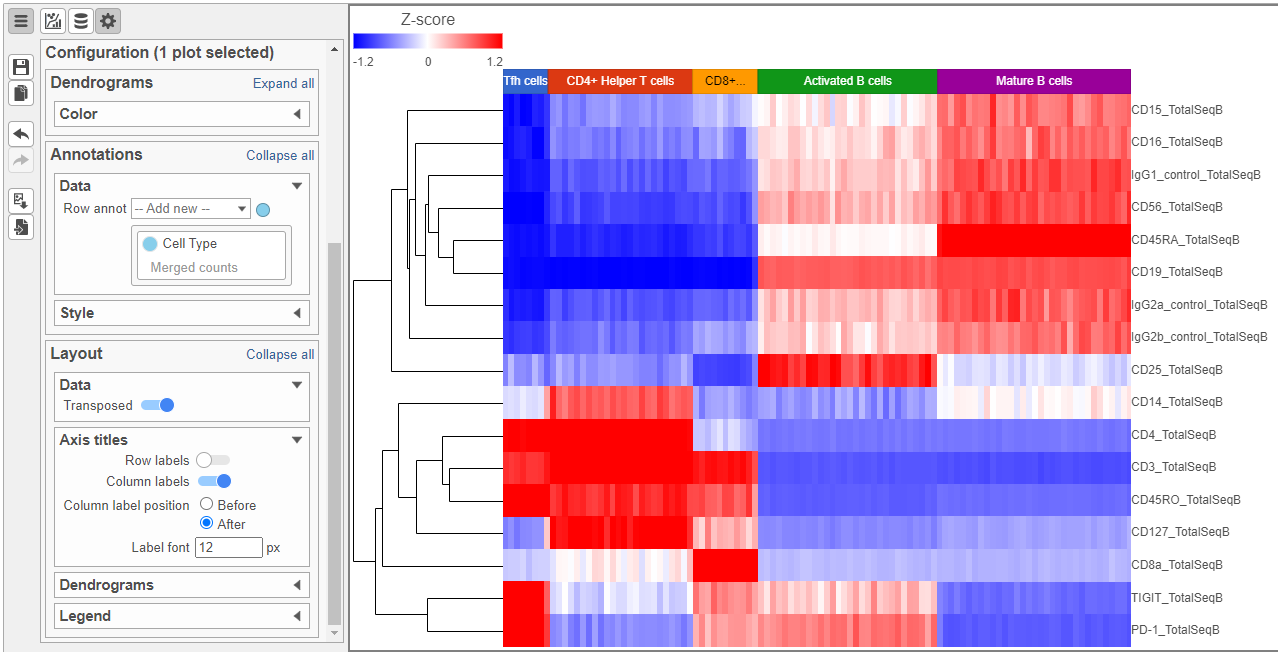 Image Removed Image Removed
|
|
Differential Analysis, Visualization, and Pathway analysis - Gene Expression Data
...
| Numbered figure captions |
|---|
| SubtitleText | GSA report for the gene expression data |
|---|
| AnchorName | GSA genes result |
|---|
|
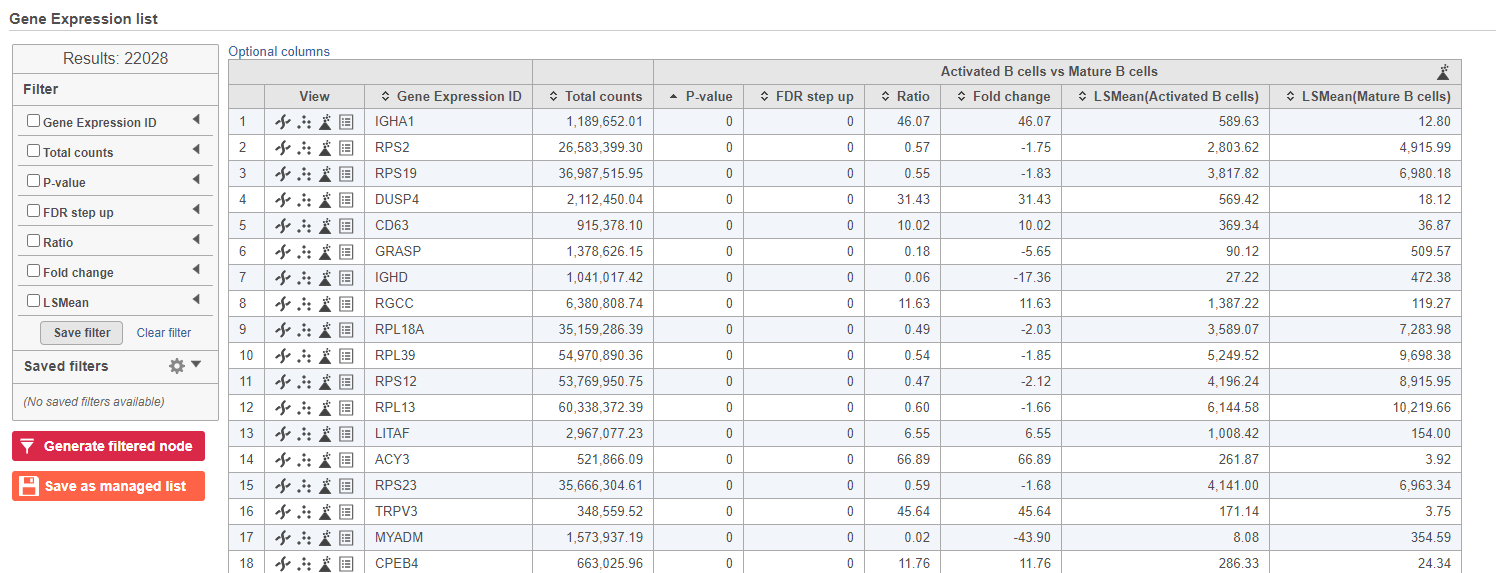 Image Removed Image Removed
|
|
Because more than 20,000 genes have been analyzed, it is useful to use a volcano plot to get an idea about the overall changes.
...
| Numbered figure captions |
|---|
| SubtitleText | The volcano plot can be configured using various options in the Configuration and Selection cards |
|---|
| AnchorName | Volcano plot gene expression |
|---|
|
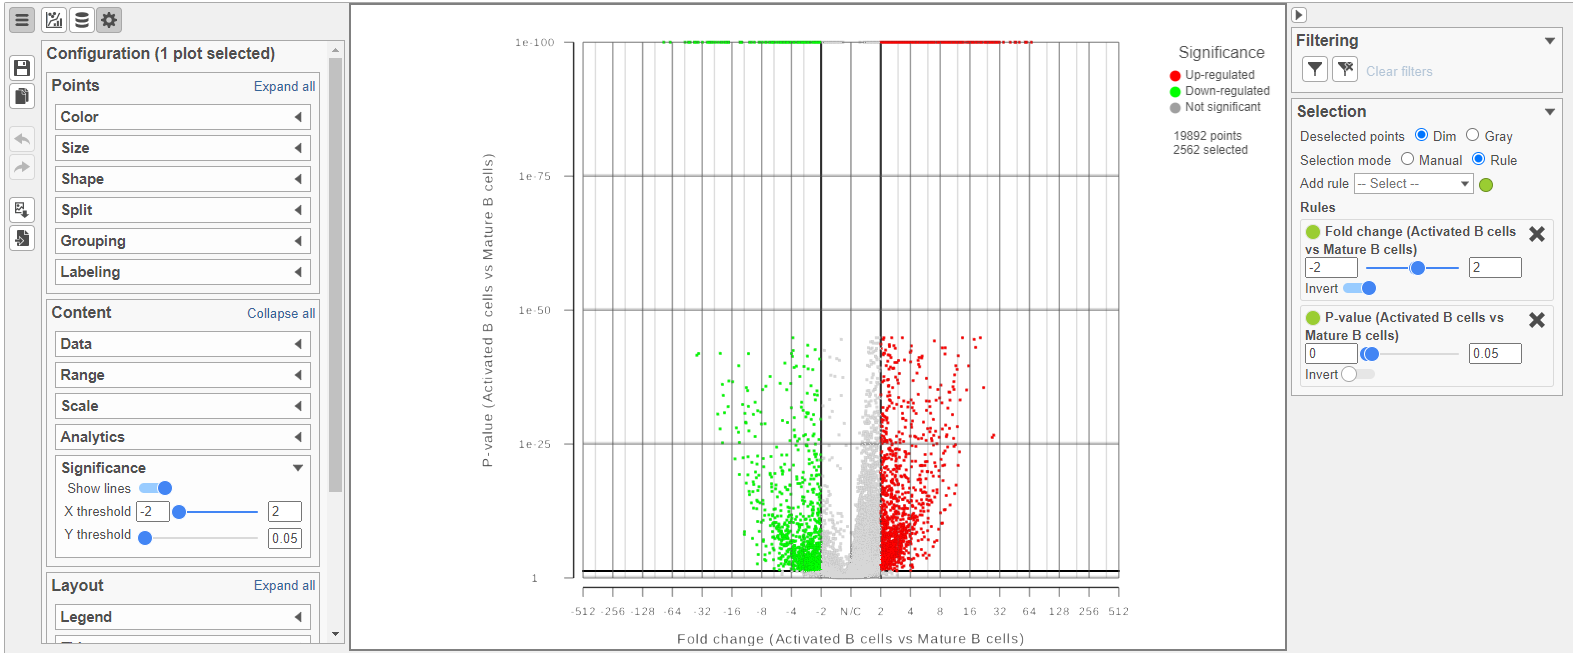 Image Removed Image Removed
|
|
- Click the GSA report tab in your web browser to return to the full report
...
| Numbered figure captions |
|---|
| SubtitleText | Use the panel on the left to filter the list for significant genes |
|---|
| AnchorName | Significant genes |
|---|
|
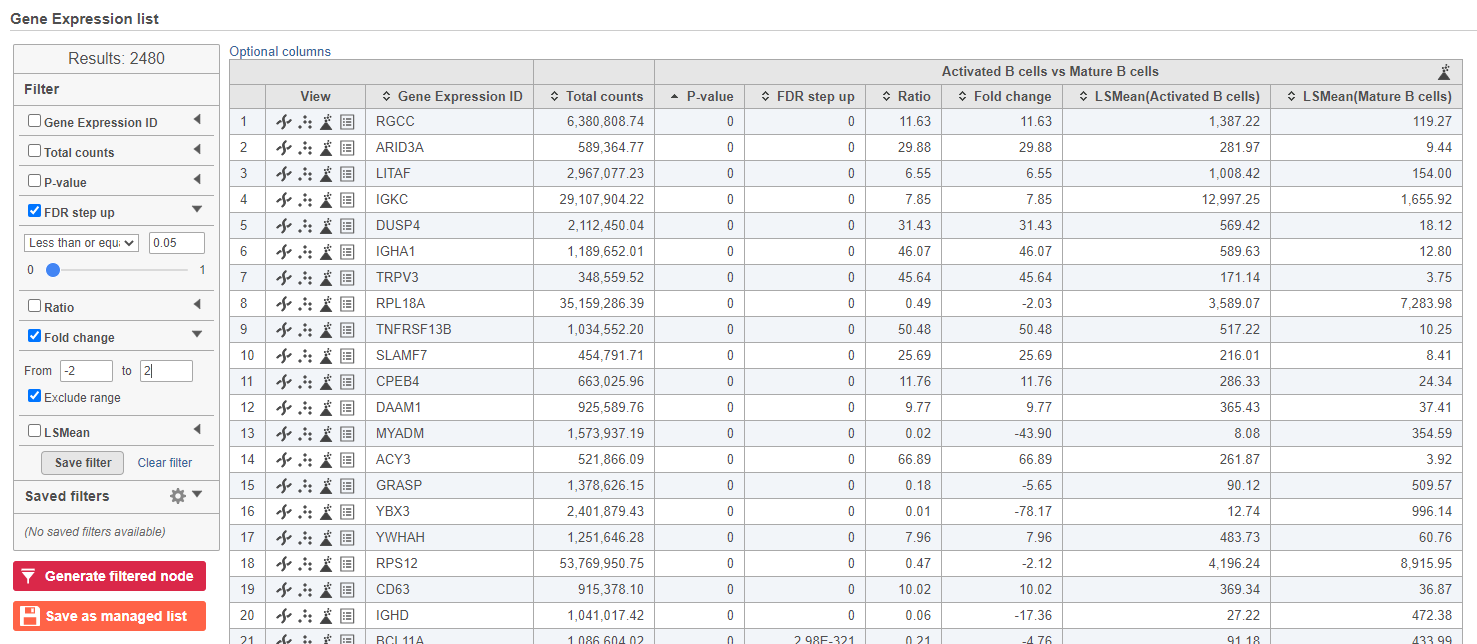 Image Removed Image Removed
|
|
- Click
 to create a new data node including only these significantly different genes
...
| Numbered figure captions |
|---|
| SubtitleText | Transcriptional misregulation in cancer pathway with significant genes highlighted in green and red |
|---|
| AnchorName | Transcriptional misregulation in cancer |
|---|
|
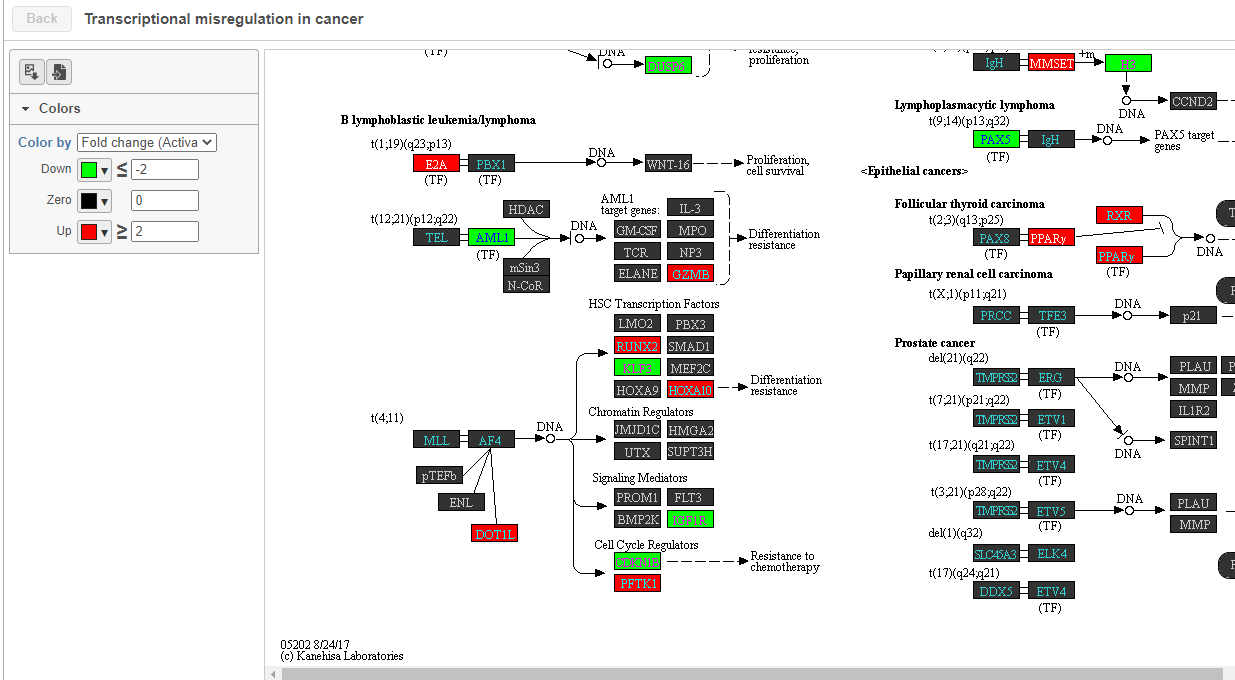 Image Removed Image Removed
|
|
| Numbered figure captions |
|---|
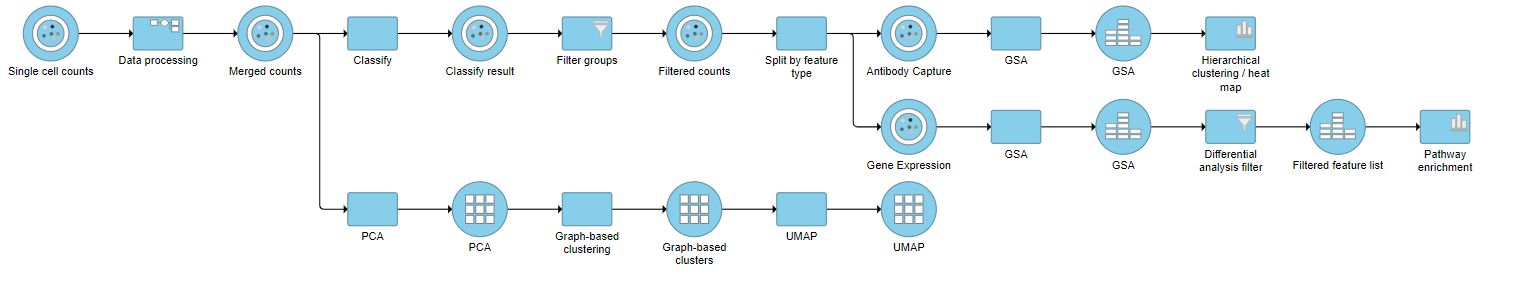
| SubtitleText | Final CITE-Seq pipeline |
|---|
| AnchorName | CITE-Seq final pipeline |
|---|
|
|
...