Page History
...
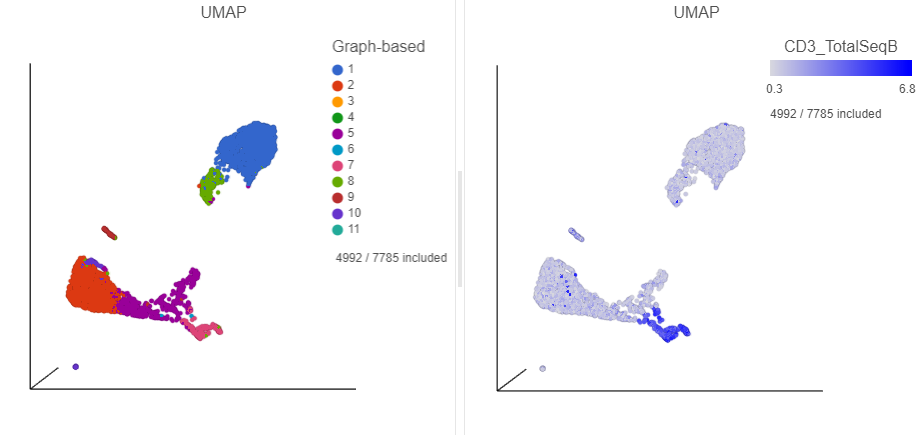
- Find the CD3_TotalSeqB protein marker in the biomarker table
- Click and drag the CD3_TotalSeqB onto the UMAP plot on the right
- Drop the CD3_TotalSeqB protein marker onto the Color configuration option on the plot
While these cells express T cell markers, they also group closely with other putative B cells and express B cell markers (CD19). Therefore, these cells are likely to be doublets.
| Numbered figure captions | ||||
|---|---|---|---|---|
| ||||
|
- Select either of the UMAP plots
- Click on the Selection card on the right
- Click to select cluster 6 and 7
- In the Classification card on the right, click Classify selection
- Label the cells as Doublets
- Click Save
- Click
 in the Filtering card on the right to exclude the selected points
There still appear to be some CD3 positive cells left on the plot, even after clusters 6 and 7 have been excluded.
- Click
to remove the Graph-based selection rule from the Selection card
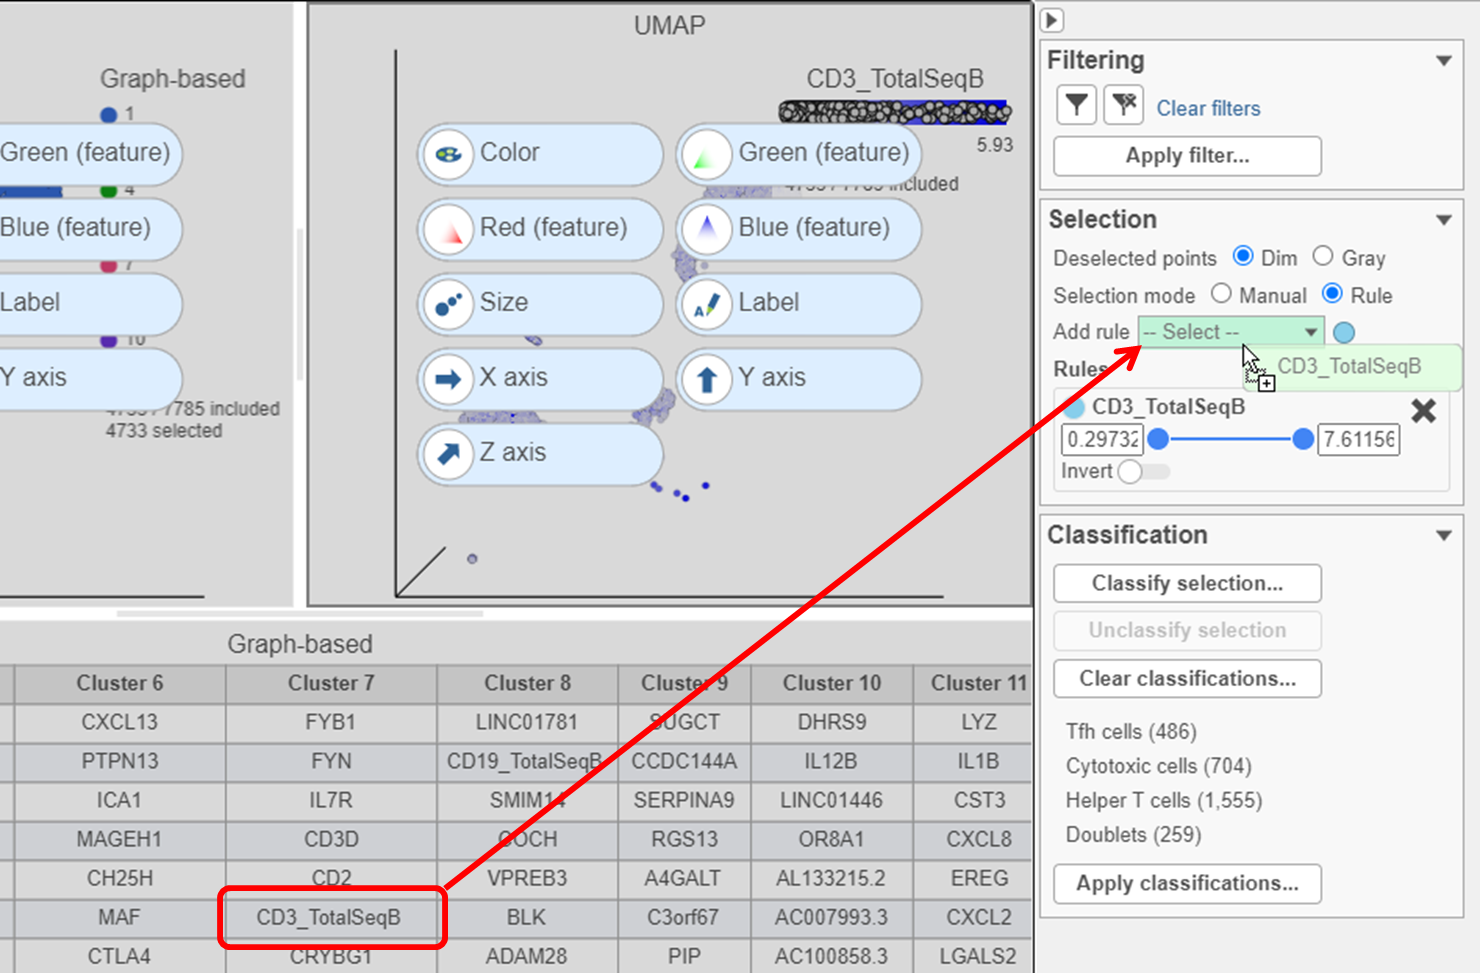
- Find the CD3_TotalSeqB protein marker in the biomarker table
- Click and drag CD3_TotalSeqB onto the Add rule drop-down list in the Selection card (Figure ?)
| Numbered figure captions | ||||
|---|---|---|---|---|
| ||||
|
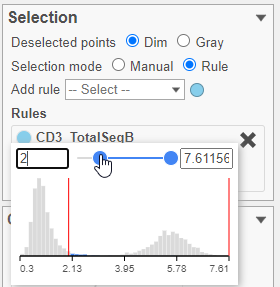
- Set the minimum threshold to 2 in the CD3_TotalSeqB selection rule (Figure?)
| Numbered figure captions | ||||
|---|---|---|---|---|
| ||||
|
- In the Classification card on the right, click Classify selection
- Choose Doublets from the drop-down list of cell labels
- Click Save
- Click in the Filtering card on the right to exclude the selected points
The remaining CD3 positive cells have been added to the Doublet classification.
The biomarkers for clusters 1 and 2 also show an interesting pattern. Cluster 1 lists IGHD as its top biomarker, while cluster 2 lists IGHA1. Both IGHD (Immunoglobulin Heavy Constant Delta) and IGHA1 (Immunoglobulin Heavy Constant Alpha 1) encode classes of the immunoglobulin heavy chain constant region. IGHD is part of IgD, which is expressed by mature B cells, and IGHA1 is part of IgA1, which is expressed by activated B cells. We can color the plot by both of these genes to visualize their expression.
- Click, drag and drop IGHD from the biomarker table onto the Green (feature) configuration option on the UMAP plot on the right
- Click, drag and drop IGHA1 from the biomarker table onto the Red (feature) configuration option on the UMAP plot on the right
| Additional assistance |
|---|
| Rate Macro | ||
|---|---|---|
|
...
Overview
Content Tools