...
| Numbered figure captions |
|---|
| SubtitleText | Lasso around CD19 positive cells |
|---|
| AnchorName | Selected CD19 positive cells |
|---|
|
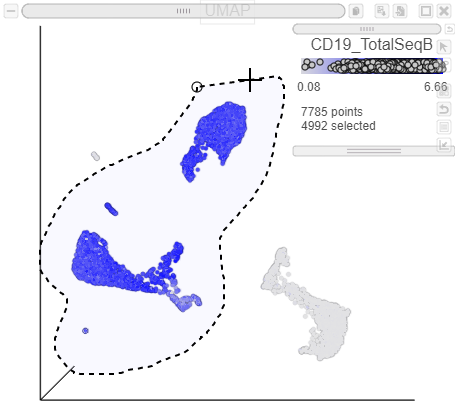 Image Added Image Added
|
The plots will rescale to include the selected points. The CD19 positive cells include cells from graph-based clusters 1, 2, 5, 6, 7, 8, 9, and 10 (Figure ?).
| Numbered figure captions |
|---|
| SubtitleText | Filtered CD19 positive cells |
|---|
| AnchorName | Filtered CD19 positive cells |
|---|
|
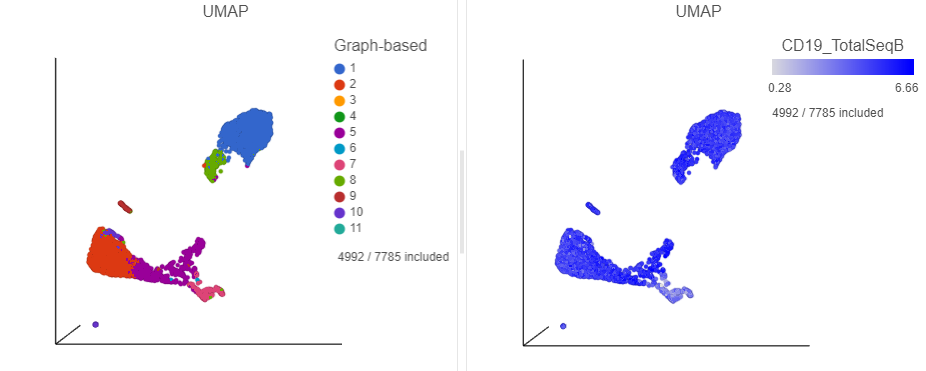 Image Added Image Added
|
Inspection of the biomarker table shows that clusters 6 and 7 both show signs of expressing T cell markers (e.g. CD3D and IL7R genes, and CD3 protein) and we have seen previously that these clusters likely correspond the T cells.
- Find the CD3_TotalSeqB protein marker in the biomarker table
- Click and drag the CD3_TotalSeqB onto the UMAP plot on the right
- Drop the CD3_TotalSeqB protein marker onto the Color configuration option
| Numbered figure captions |
|---|
| SubtitleText | Some cells within the CD19 positive clusters show signs of expressing T-cells markers |
|---|
| AnchorName | Color cells by CD3 |
|---|
|
|
...