Page History
...
| Numbered figure captions | ||||
|---|---|---|---|---|
| ||||
|
You will see a message telling you a new task has been enqueued.
...
| Numbered figure captions | ||||
|---|---|---|---|---|
| ||||
|
Merge Protein and mRNA data
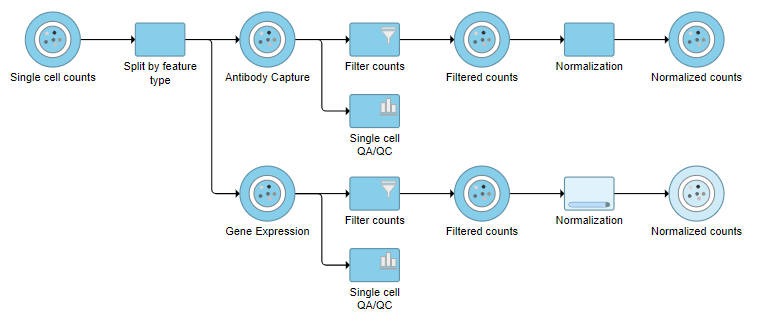
For quality filtering and normalization, we needed to have the two data types separate as the processing steps were distinct. For downstream analysis, we want to be able to analyze protein and mRNA data together. To bring the two data types back together, we will merge the two normalized counts data nodes.
- Click the Normalized counts data node on the Antibody Capture branch of the pipeline
- Click Pre-analysis tools in the toolbox
- Click Merge matrices
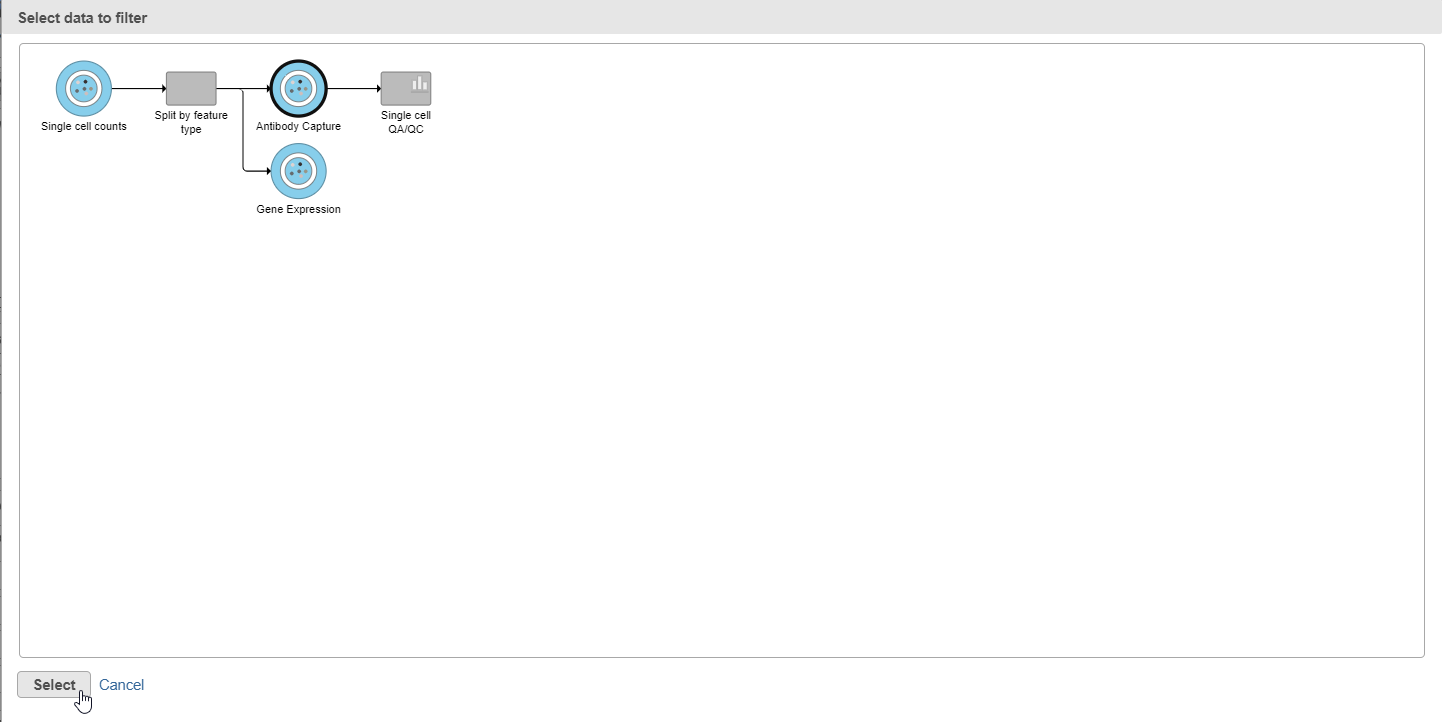
- Click Select data node to launch the data node selector
Data nodes that can be merged with the Antibody Capture branch Normalized counts data node are shown in color (Figure ?).
| Numbered figure captions | ||||
|---|---|---|---|---|
| ||||
|
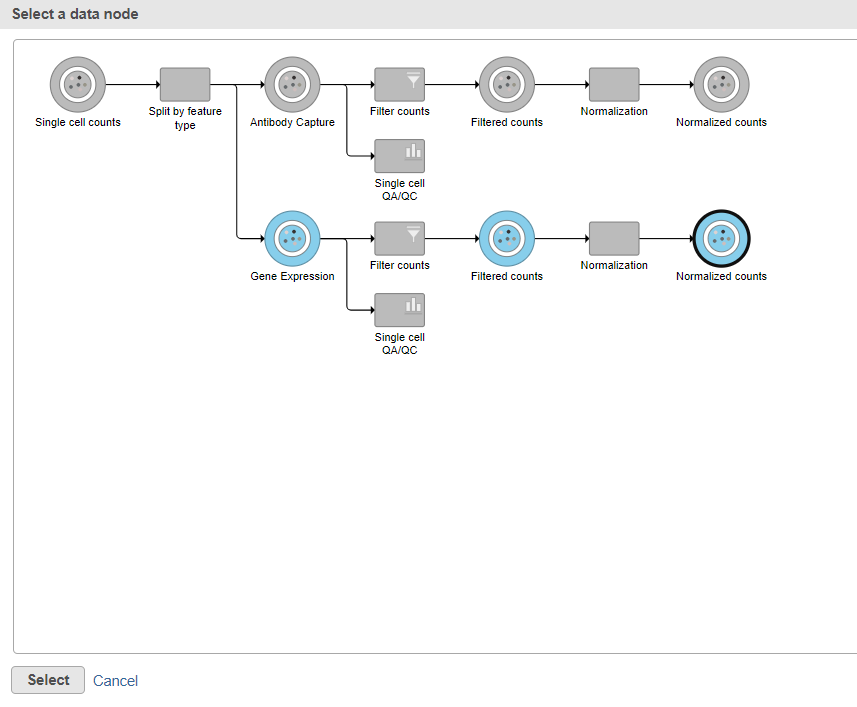
- Click the Normalized counts data node on the Gene Expression branch of the pipeline
- Click Select
- Click Finish to run the task
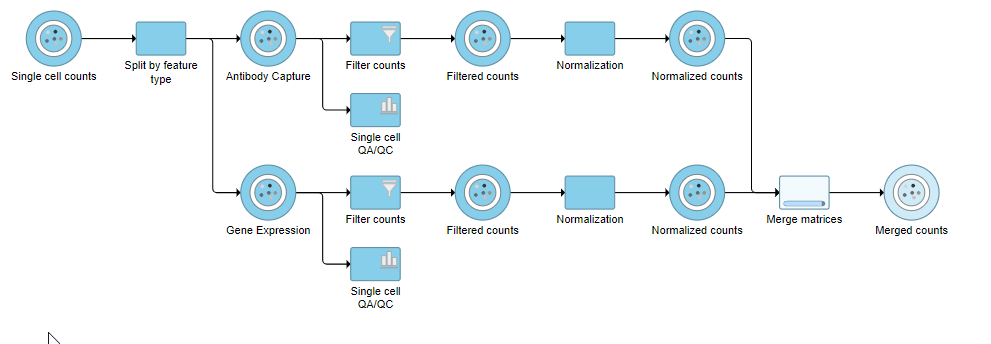
The output is a Merged counts data node (Figure ?). This data node will include the normalized counts of our protein and mRNA data. The intersection of cells from the two input data nodes is retained so only cells that passed the quality filter for both protein and mRNA data will be included in the Merged counts data node.
| Numbered figure captions | ||||
|---|---|---|---|---|
| ||||
|
Collapsing tasks to simplify the pipeline
To simplify the appearance of the pipeline, we can group task nodes into a single collapsed task. Here, we will collapse the filtering and normalization steps.
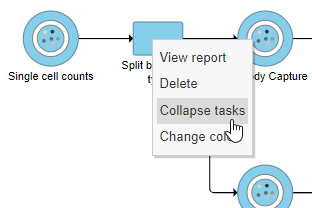
- Right-click the Split by feature type task node
- Choose Collapse tasks from the pop-up dialog (Figure ?)
| Numbered figure captions | ||||
|---|---|---|---|---|
| ||||
|
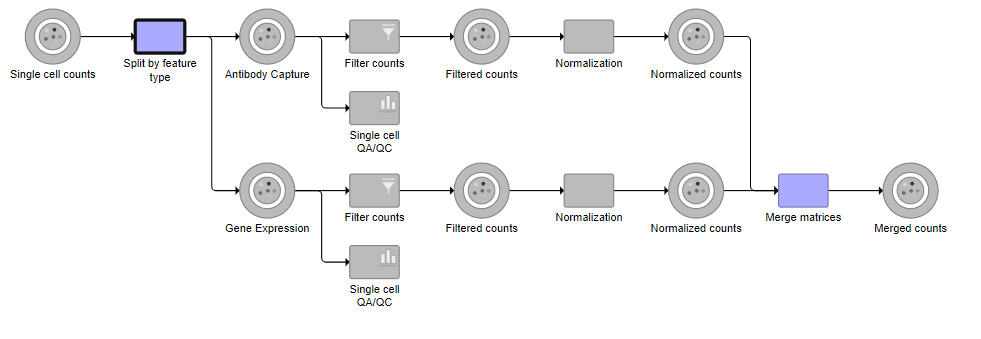
Tasks that can be selected for the beginning and end of the collapsed section of the pipeline are highlighted in purple (Figure ?). We have chosen the Split matrix task as the start and we can choose Merge matrices as the end of the collapsed section.
| Numbered figure captions | ||||
|---|---|---|---|---|
| ||||
|
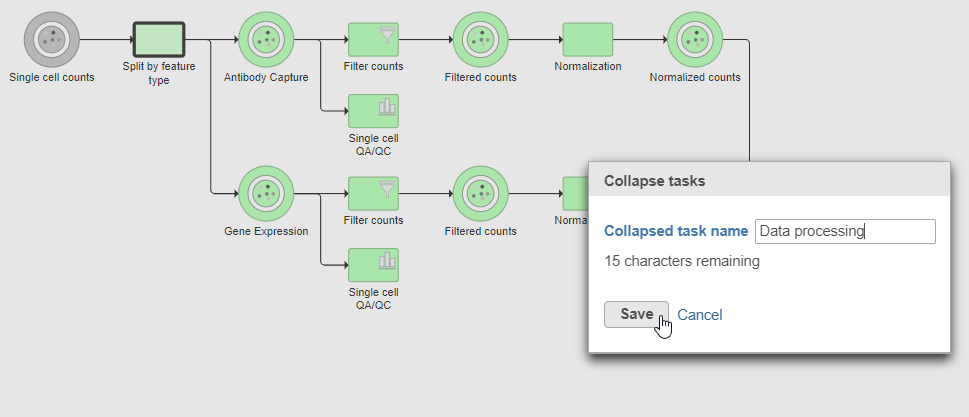
- Click the Merge matrices task to choose it as the end of the collapsed section
- Name the Collapsed task Data processing
- Click Save (Figure ?)
| Numbered figure captions | ||||
|---|---|---|---|---|
| ||||
|
The new collapsed task, Data processing, appears as a single rectangle on the task graph (Figure ?).
| Numbered figure captions | ||||
|---|---|---|---|---|
| ||||
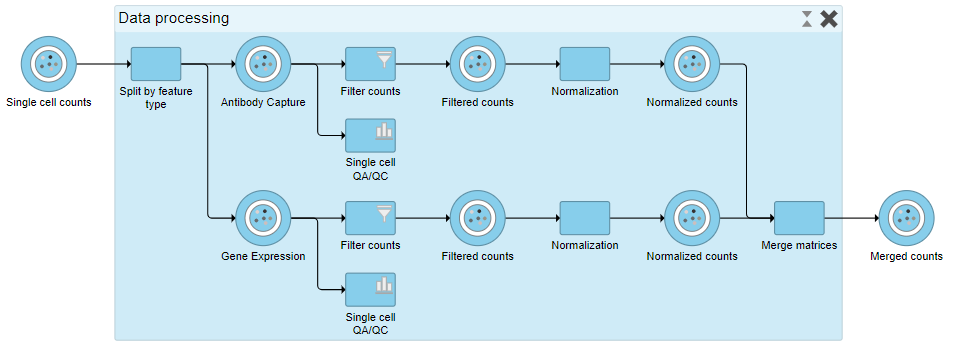
To view the tasks in Data processing, we can expand the collapsed task.
- Double-click Data processing to expand it, or right click and choose Expand collapsed task
When expanded, the collapsed task is shown as a shaded section of the pipeline with a title bar (Figure ?).
| Numbered figure captions | ||||
|---|---|---|---|---|
| ||||
|
To re-collapse the task, you can double click the title bar or click the ![]() icon in the title bar. To remove the collapsed task, you can click the
icon in the title bar. To remove the collapsed task, you can click the ![]() . Please note that this will not remove tasks, just the grouping.
. Please note that this will not remove tasks, just the grouping.
- Double-click the Data processing title bar to re-collapse
References
[1] Stoeckius, M., Hafemeister, C., Stephenson, W., Houck-Loomis, B., Chattopadhyay, P. K., Swerdlow, H., ... & Smibert, P. (2017). Simultaneous epitope and transcriptome measurement in single cells. Nature methods, 14(9), 865.
...
Overview
Content Tools