Page History
...
| Table of Contents | ||||||
|---|---|---|---|---|---|---|
|
Viewing the Data Summary Report
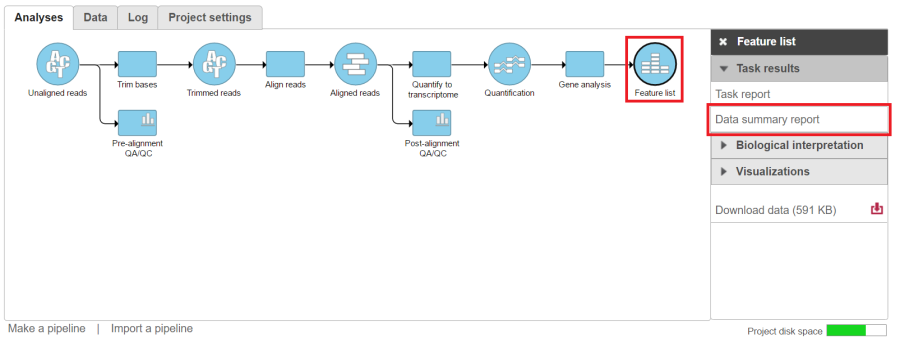
Click on an output data node under the Analyses tab of a project and choose Data summary report from the context sensitive menu on the right (Figure 1). The report will include details from all of the tasks upstream of the selected the node. If tasks have been performed downstream of the selected data node, they will not be included in the report.
| Numbered figure captions | ||||
|---|---|---|---|---|
| ||||
|
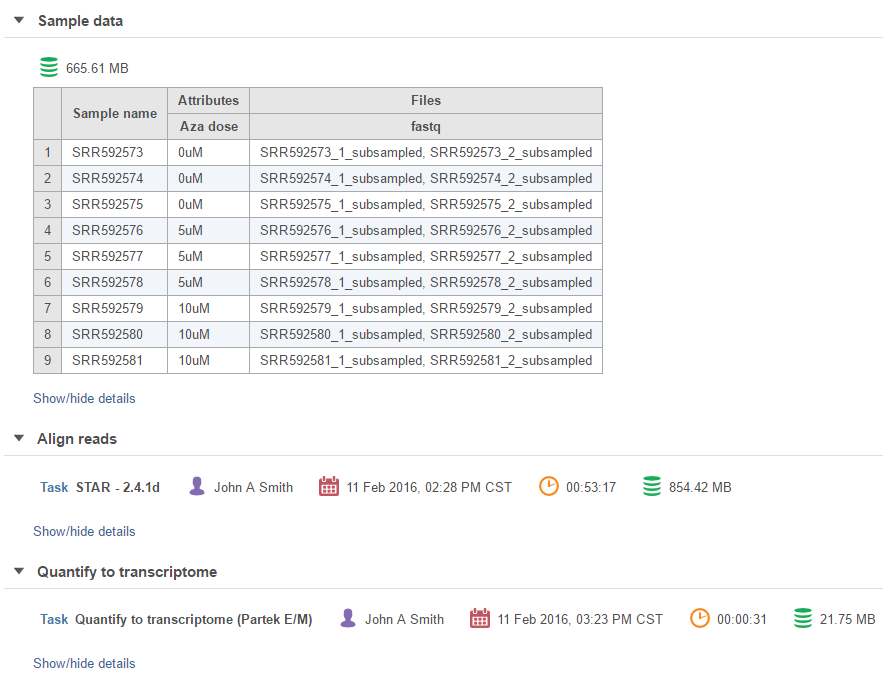
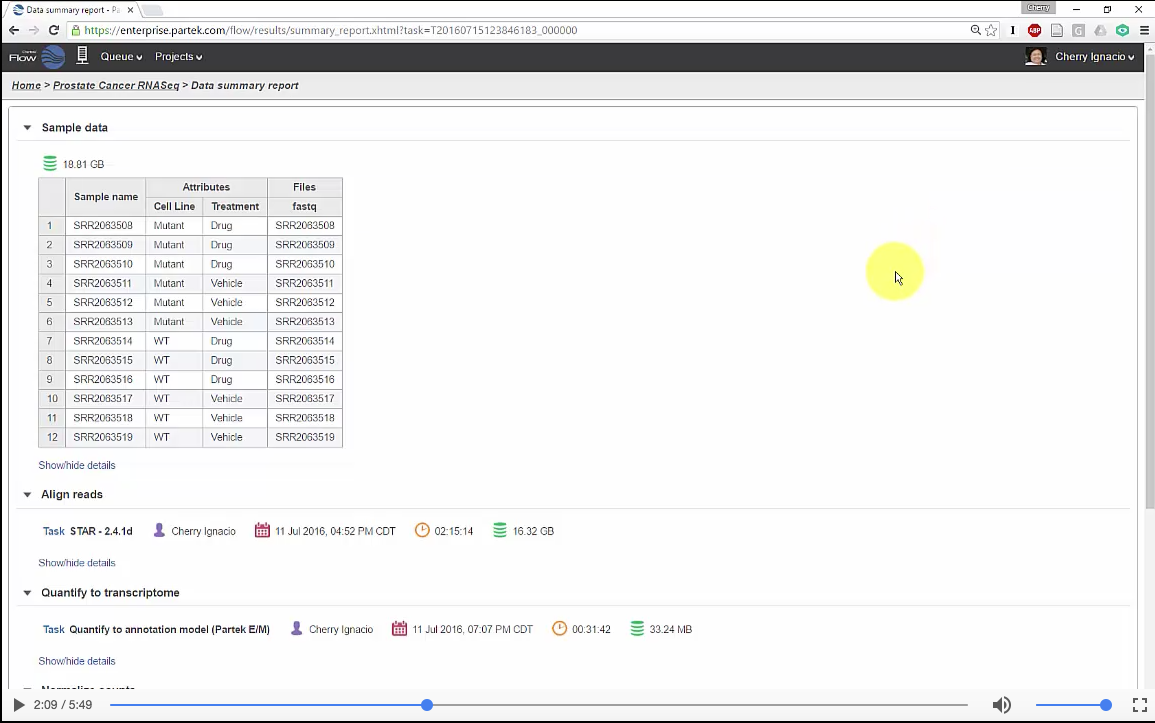
Each task will appear as a separate section on the Data summary report (Figure 2). The first section of the report (Sample data) will summarize the input samples information. Click the grey arrows ( /
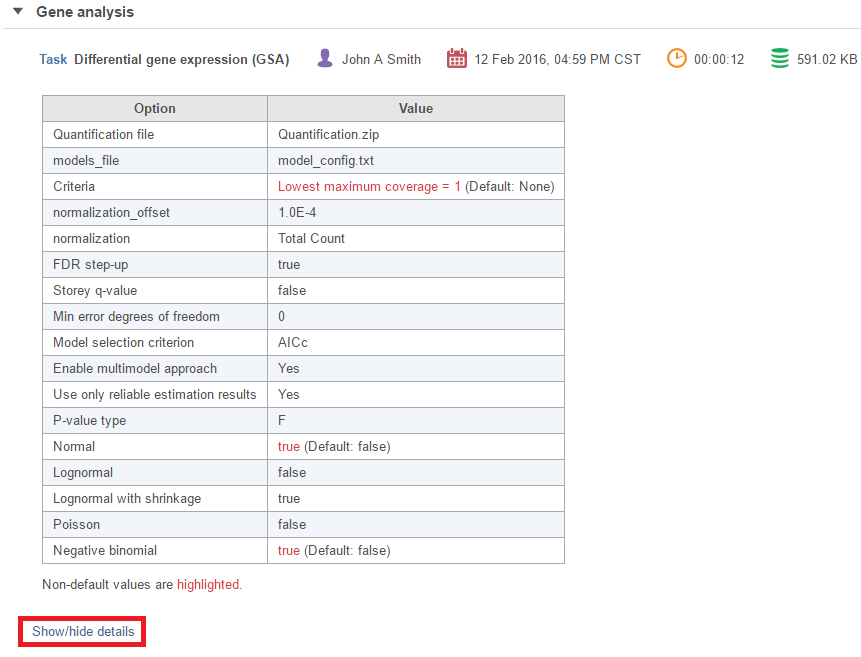
) to expand and collapse each section. When expanded, the task name, user that performed the task, start date and time, duration and the output file size are displayed (Figure 2). To view or hide a table of task settings, click Show/hide details (Figure 3).
| Numbered figure captions | ||||
|---|---|---|---|---|
| ||||
|
| Numbered figure captions | ||||
|---|---|---|---|---|
| ||||
|
Saving the Data Summary Report
The Data summary report can be saved in different formats via the web browser. The instructions below are for Google Chrome. If you are using a different browser, consult your browser's help for equivalent instructions.
Save as a PDF
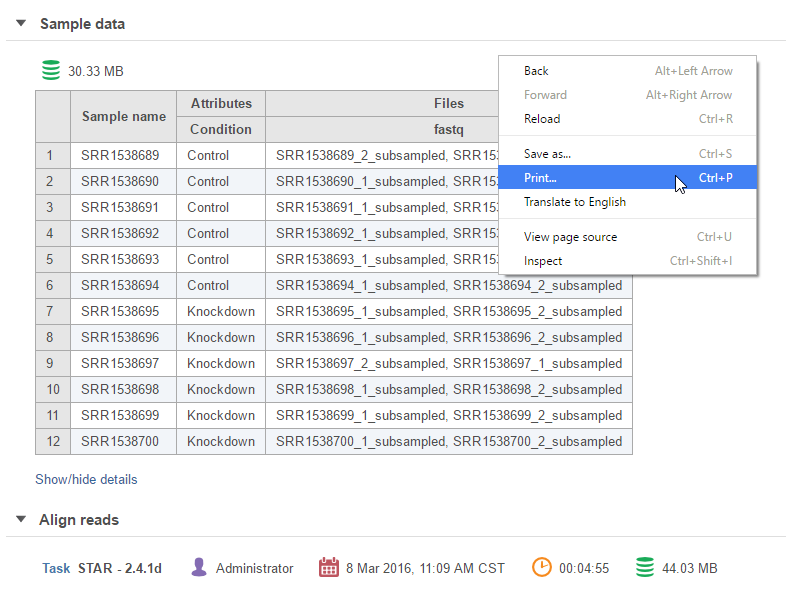
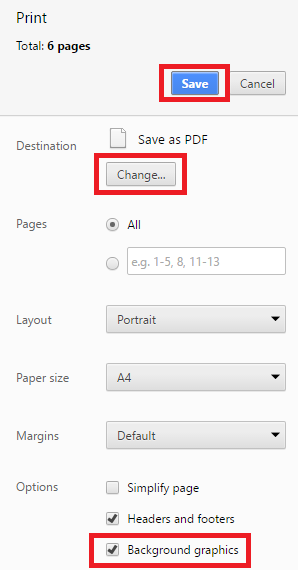
On the Data summary report, expand all sections and show all task details. Right-click anywhere on the page and choose Print... from the menu (Figure 4) or use Ctrl+P (Command+P on Mac). In the print dialog, click Change… (Figure 5) and set the destination to Save as PDF. Select the Background graphics checkbox (optional), click the blue Save button (Figure 5) and choose a file location on your local machine.
The PDF can be attached to an email and/or opened in a PDF viewer of your choice.
| Numbered figure captions | ||||
|---|---|---|---|---|
| ||||
|
| Numbered figure captions | ||||
|---|---|---|---|---|
| ||||
|
Save as HTML
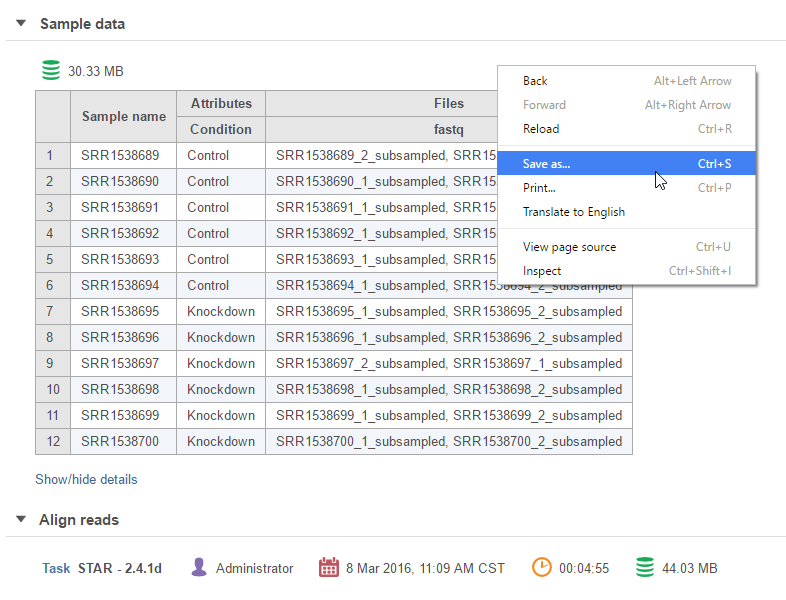
On the Data summary report, right-click anywhere on the page and choose Save as… from the menu (Figure 6) or use Ctrl+S (Command+S on Mac). Choose a file location on your local machine and set the file type to Web Page, Complete.
The HTML file can be opened in a browser of your choice.
| Numbered figure captions | ||||
|---|---|---|---|---|
| ||||
|
Quick Video Demo of the Data Summary Report
The short video clip below (with audio) shows a tutorial of looking at the Data Summary Report.
| Additional assistance |
|---|
| Rate Macro | ||
|---|---|---|
|
...
Overview
Content Tools