Page History
...
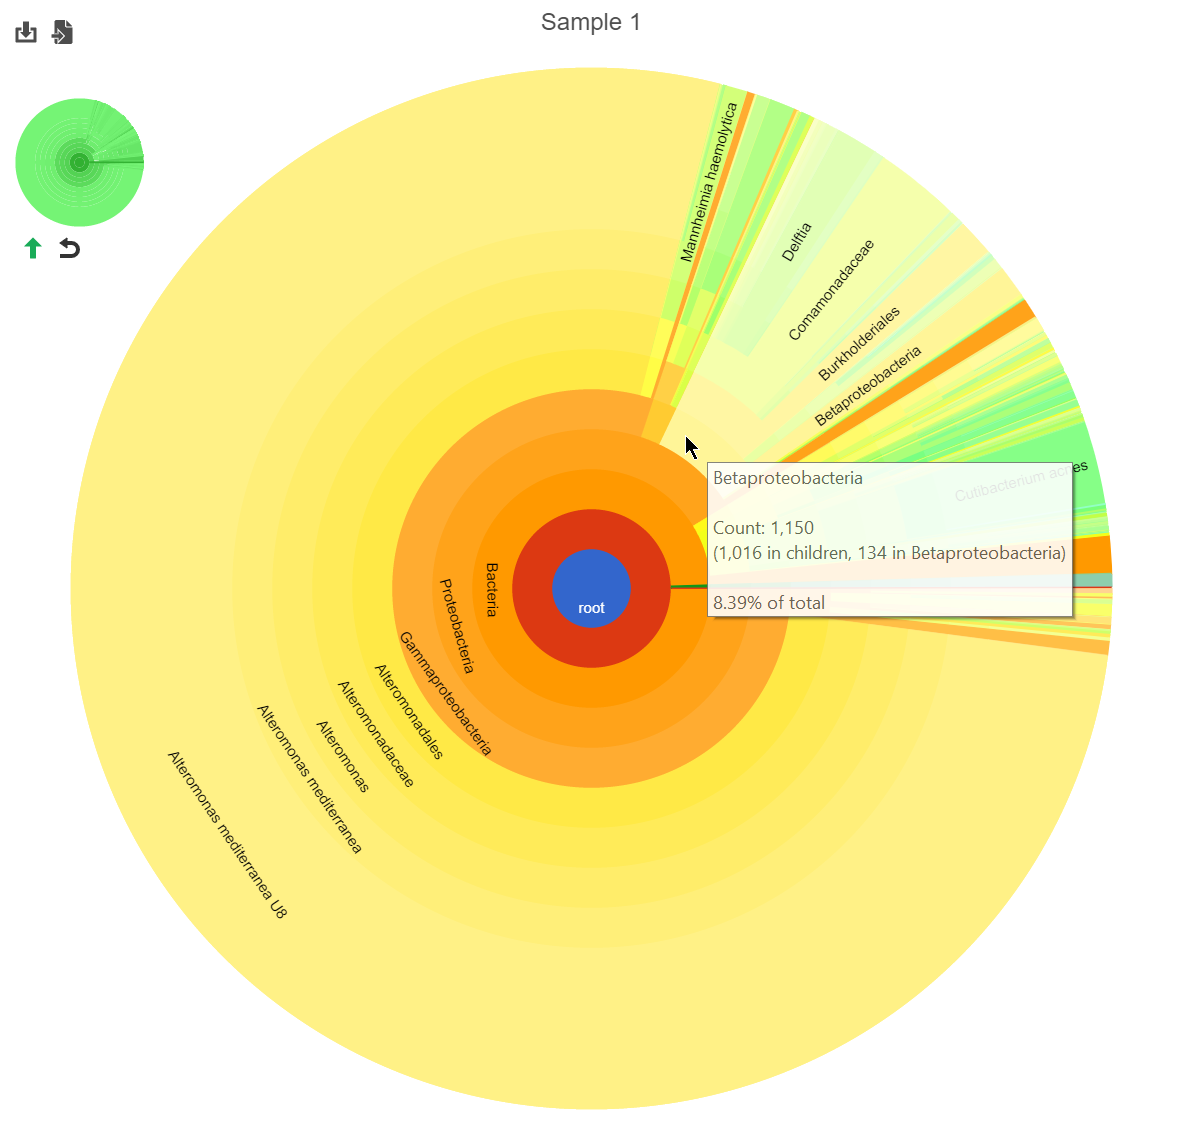
Clicking a section of the pie chart zooms in to that section by setting the selected level as the root (Figure 25).
| Numbered figure captions | ||||
|---|---|---|---|---|
| ||||
|
...
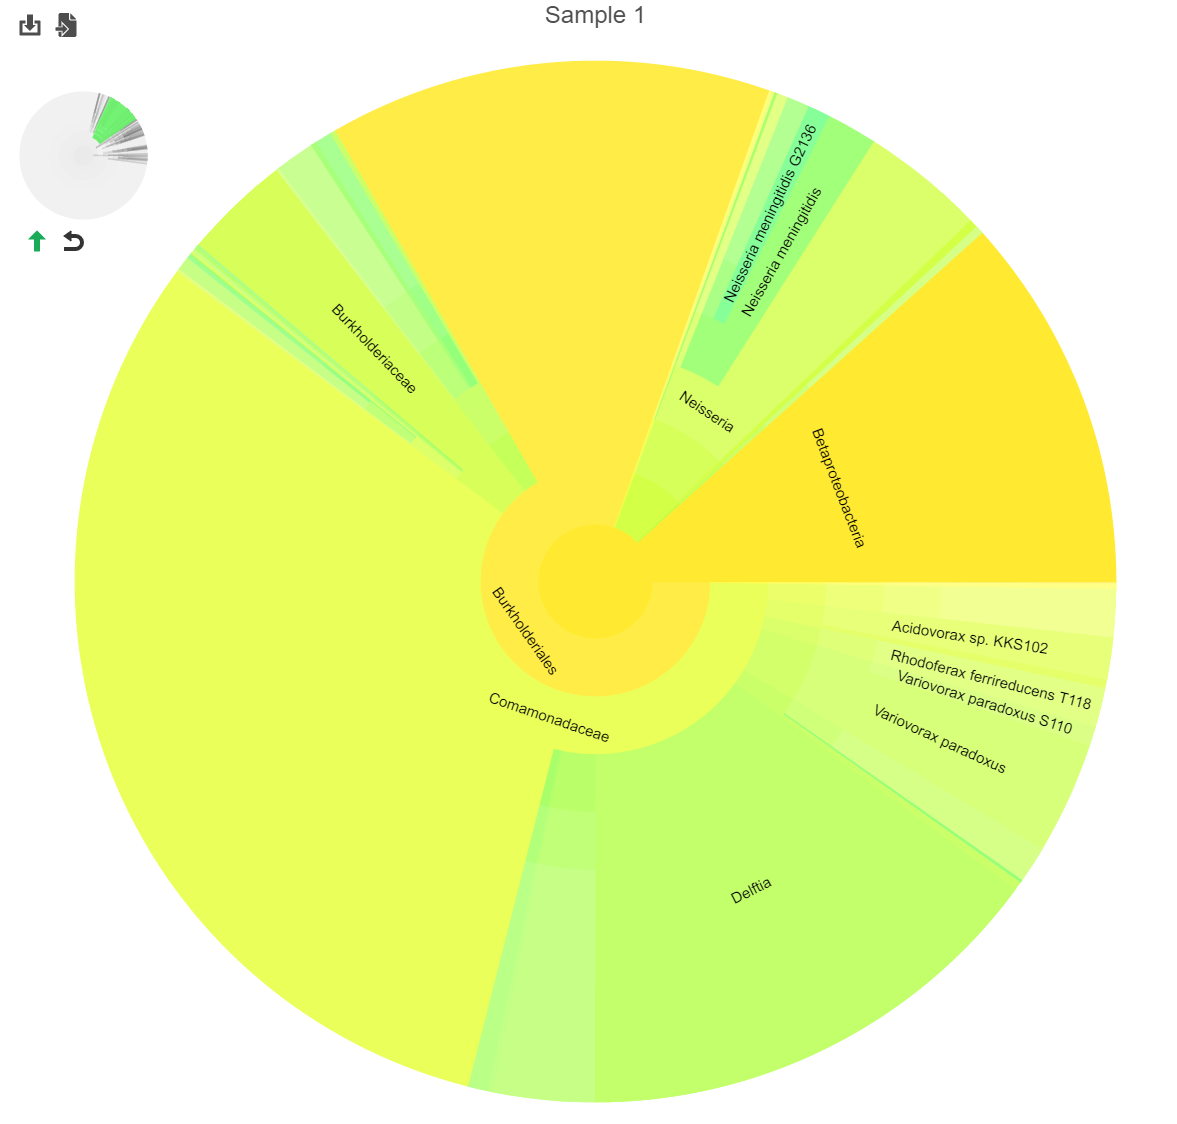
The mini-map on the upper left is shaded in green to indicate which section of the original pie chart is currently shown (Figure 25).
References
[1] Wood DE, Salzberg SL: Kraken: ultrafast metagenomic sequence classification using exact alignments. Genome Biology 2014, 15:R46.
...
Overview
Content Tools