Page History
...
| Numbered figure captions | ||||
|---|---|---|---|---|
| ||||
|
...
Removes links between pairs of points if their similarity is below the threshold. Larger values lead to a shorter run time, but can result in many singleton clusters. Default is 0.0.
Number of nearest
...
neighbors
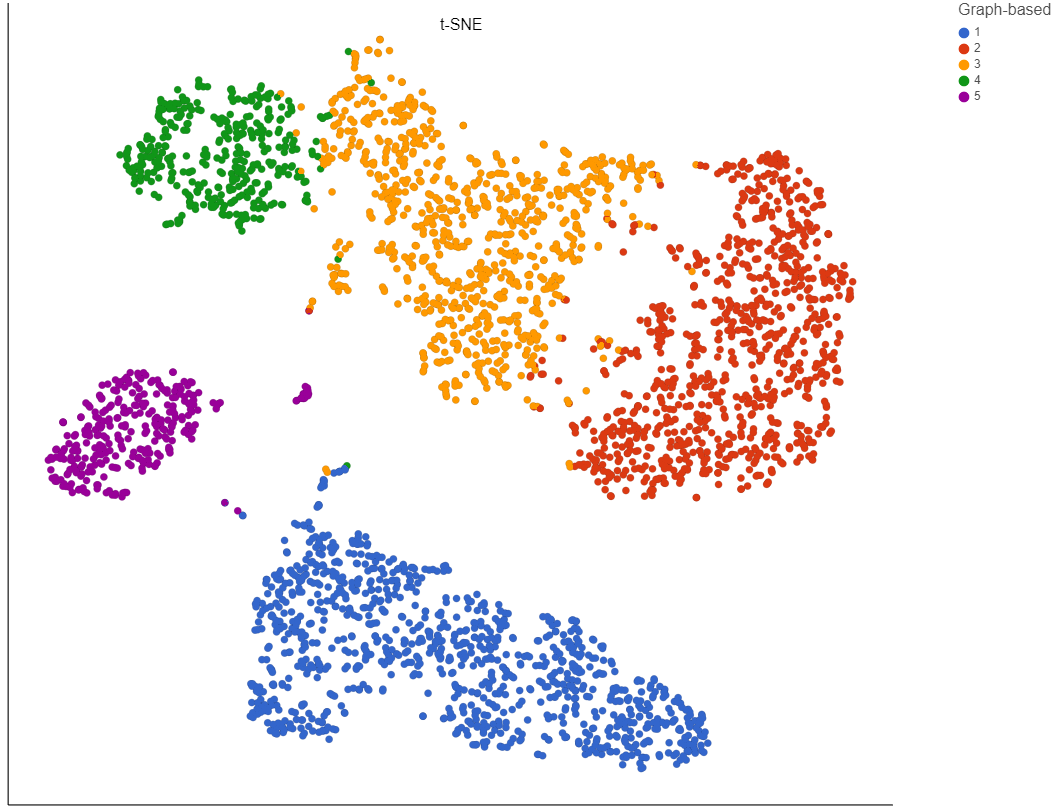
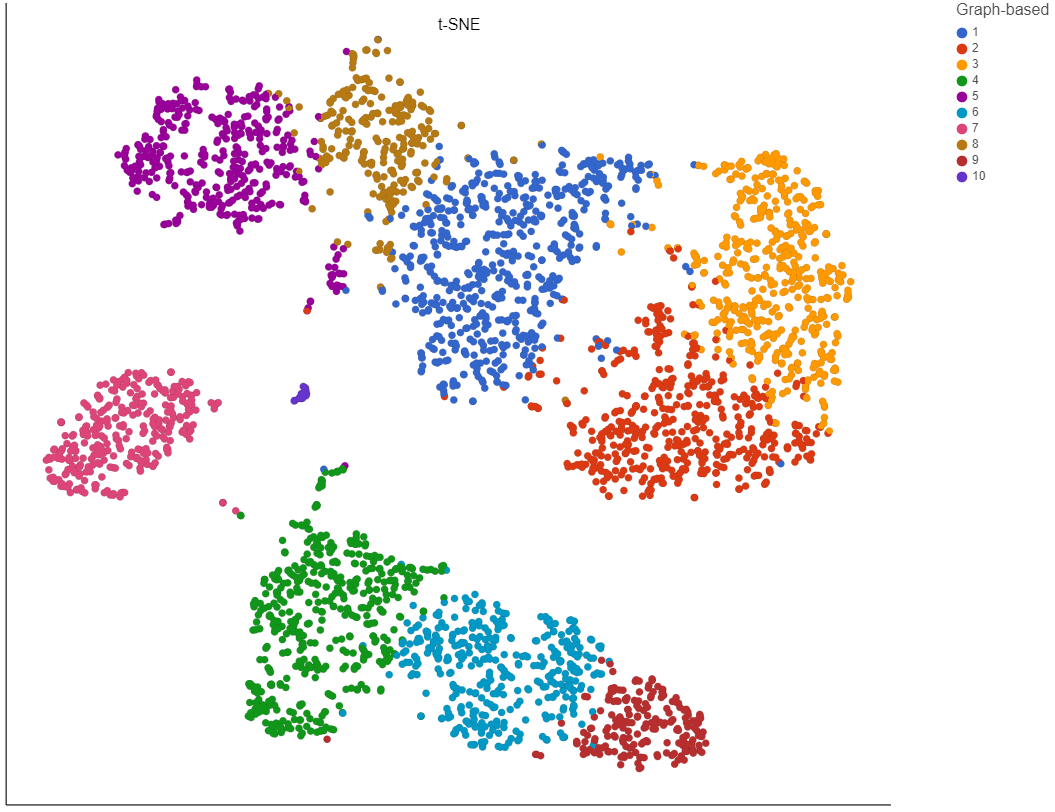
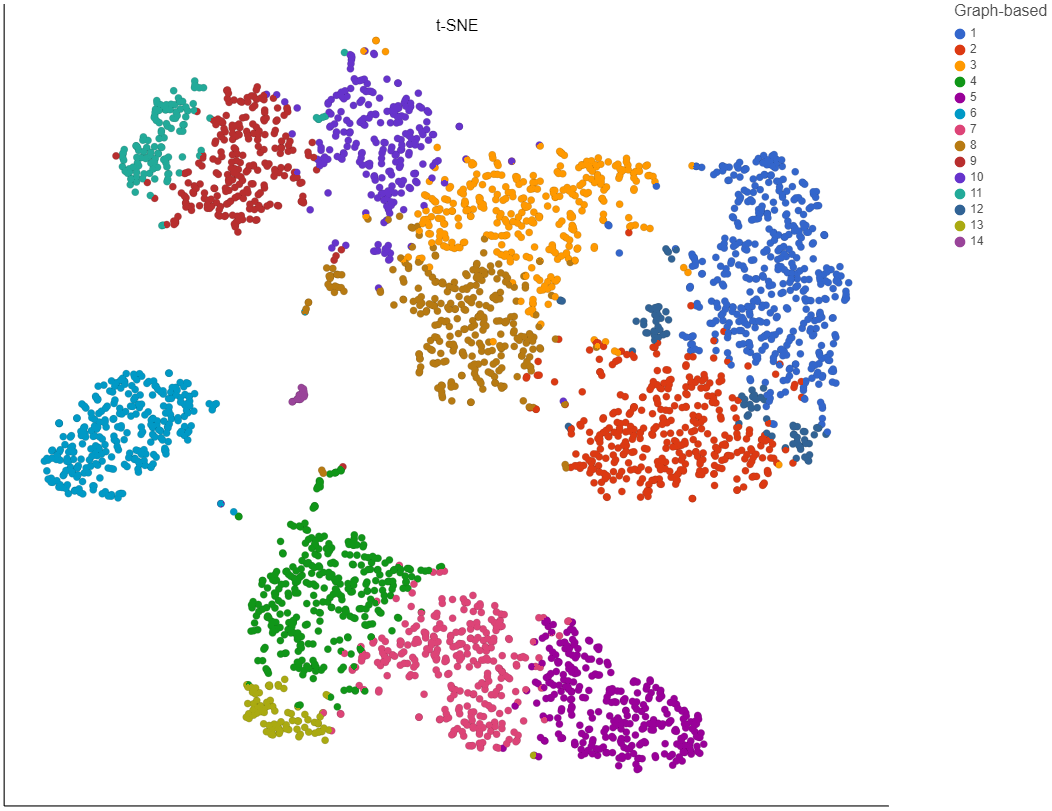
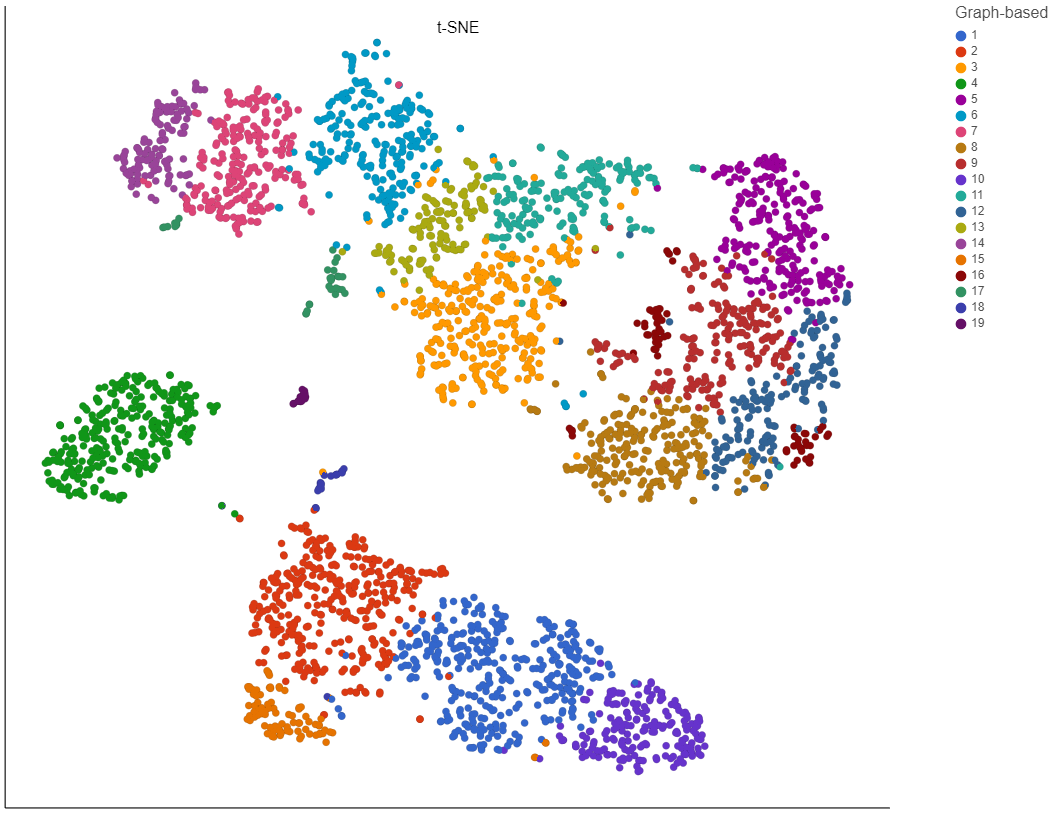
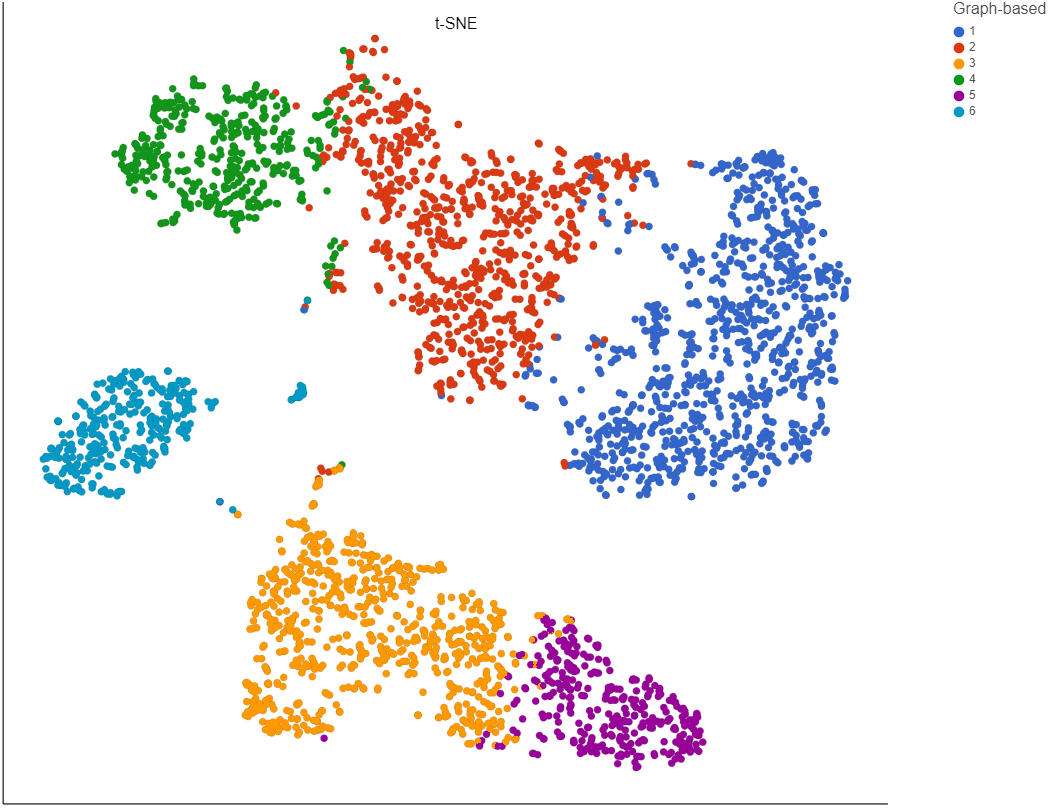
Clustering preserves the local structure of the data by focusing on the distances between each point and its k nearest neighbors. The optimal perplexity depends on the size and density of the data. Generally, a larger and/or more dense data set will benefit from a larger number of nearest neighbors. Increasing the number of nearest neighbors will increase the size of clusters and vice versa (Figure 3). Default is 30. The range of possible values is 3 to 100.
...
| Numbered figure captions | ||||
|---|---|---|---|---|
| ||||
|

Scale
...
This parameter can be used to speed up clustering at the expense of accuracy. Larger scale implies greater accuracy and helps avoid singletons, but takes more time to run. To maximize accuracy, the total count of observations being clustered should be below the product of nearest neighbors and scale. Default is 100,000. The range of possible values is 1 to 100,000.
...
Overview
Content Tools