Page History
...
- Click Import data
- Click Single cell data
- Choose the filtered HDF5 file produced by Cell Ranger
- Click Next
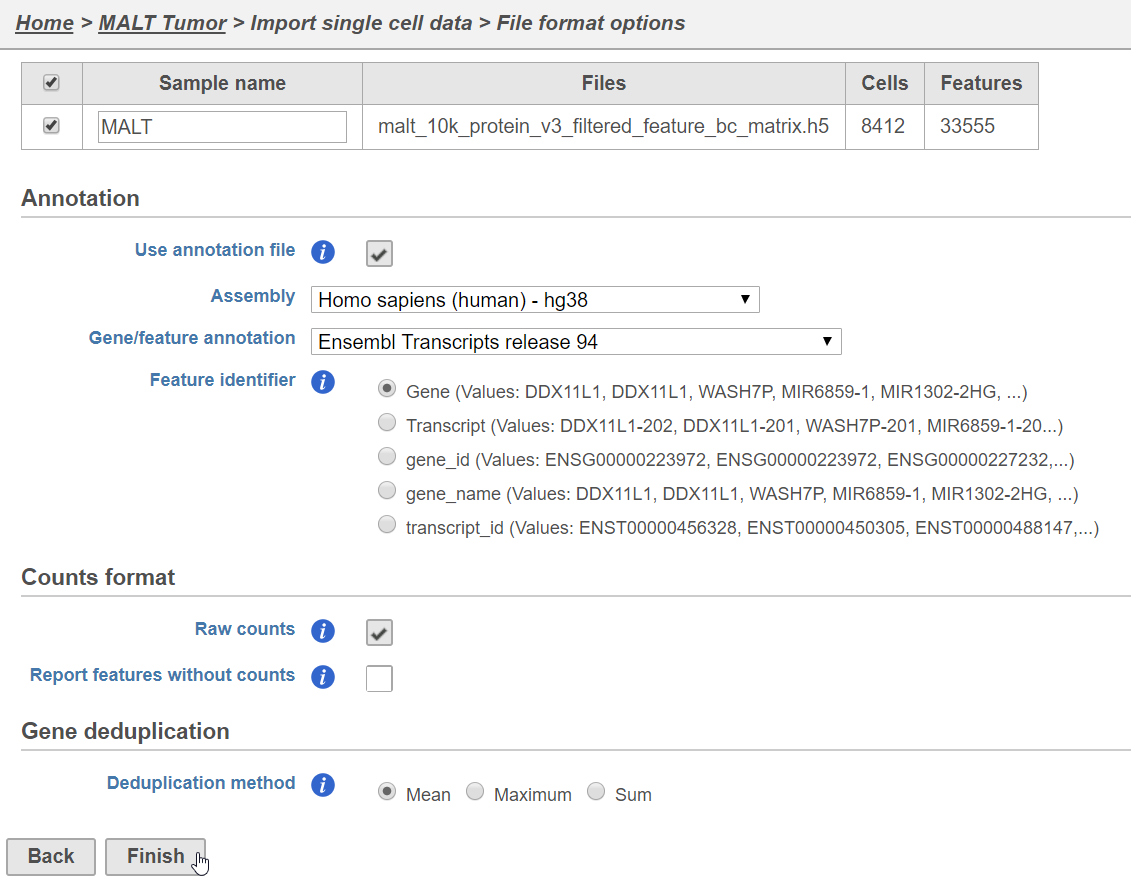
- Name the sample (default is the file name)
- Specify the annotation used for the gene expression data (here, we choose hg38 and Ensembl 94)
- Uncheck Report features without counts
- Click FinishFinish (Figure 1)
| Numbered figure captions | ||||
|---|---|---|---|---|
| ||||
|
A Single cell counts data node will be created after the file has been imported.
...
A rectangle, or task node, will be created for Split matrix along with two output circles, or data nodes, one for each data type (Figure ). The labels for these data types are determined by features.csv file used when processing the data with Cell Ranger. Here, our data is labeled Gene Expression, for the mRNA data, and Antibody Capture, for the protein data.
| Numbered figure captions | ||||
|---|---|---|---|---|
| ||||
|

Filter low-quality cells
An important step in analyzing single cell RNA-Seq data is to filter out low-quality cells. A few examples of low-quality cells are doublets, cells damaged during cell isolation, or cells with too few reads to be analyzed. In a CITE-Seq experiment, protein aggregation in the antibody staining reagents can cause a cell to have a very high number of counts; these are low-quality cells are can be excluded. Additionally, if all cells in a data set are expected to show a baseline level of expression for one of the antibodies used, it may be appropriate to filter out cells with very low counts. You can do this in Partek Flow using the Single cell QA/QC task.
...
Overview
Content Tools