Page History
...
| Numbered figure captions | ||||
|---|---|---|---|---|
| ||||
|

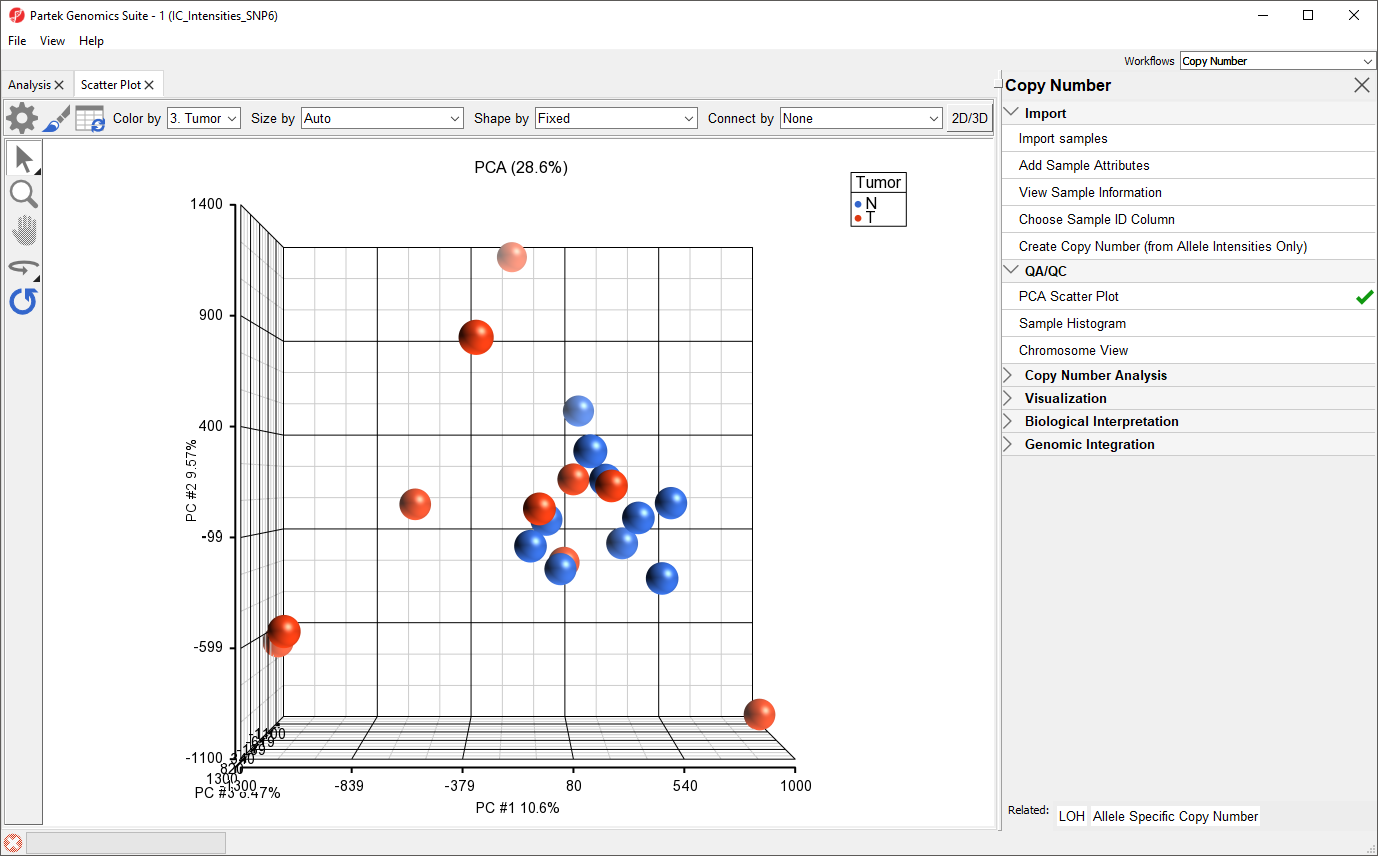
Each dot on the plot corresponds to a single sample and can be thought of as a summary of all normalized marker intensities for the sample. The first categorical column is used to color the plot, here tumor samples are shown in red and normal samples are shown in blue.
...
| Numbered figure captions | ||||
|---|---|---|---|---|
| ||||
|

| Page Turner | ||
|---|---|---|
|
...
Overview
Content Tools