Page History
| Table of Contents | ||||||
|---|---|---|---|---|---|---|
|
The XY Plot plot / Bar bar chart displays the intensity of one probe(set)/gene across two categorical variables. Only one probe(set)/gene may be visualized at a time.
Invoking from a gene list
We will invoke an XY Plot plot from a gene list child spreadsheet with genes on rows. The parent spreadsheet should include the categorical variables you want to chart.
...
| Numbered figure captions | ||||
|---|---|---|---|---|
| ||||
|
An XY Plot plot will be displayed in a new tab (Figure 2).
...
While most of the plot controls are shared with Dot Plotdot plot, XY Plot plot does have a few unique options.
...
Lines, but not points, can be selected when using Selection Mode (![]() ).
).
Invoking from the parent spreadsheet
...
To switch this plot from to one of the gene lists we have created, we can use the drop-down menu next to the previous/next controls.
Bar Chart Plots
The displayed by a XY Plot plot can instead be displayed as a bar chart with overlayed bars, vertically stacked bars, or horizontally stacked bars. A bar chart can be directly invoked or an XY Plot plot can be converted into a bar chart (and vice versa).
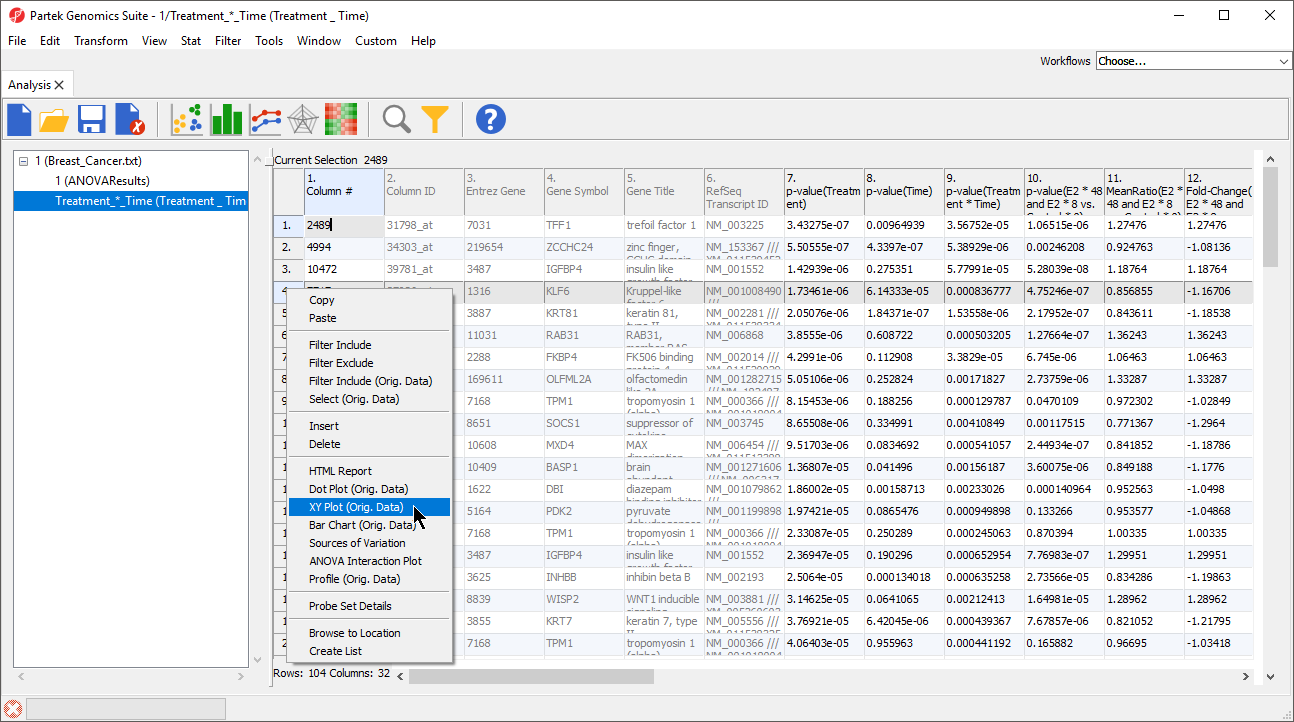
- Invoke the plot from a gene list using the Bar Chart (Orig. Data) option in the pop-up menu (Figure 1)
- Invoke the plot from the main toolbar by selecting one of the bar chart options in the Line Style drop-down menu (Figure 4)
- Invoke the plot as an XY Plotplot, select (
 ), then select one of the bar chart options from the Plot Style drop-down menu in the Plot Rendering Properties dialog (Figure 6)
...
Overview
Content Tools