Page History
| Table of Contents | ||||||
|---|---|---|---|---|---|---|
|
The Genome Viewer Chromosome View in the Partek Genomics Suite software enables visualization of differential expression and alternative splicing results in RNA-Seq data.
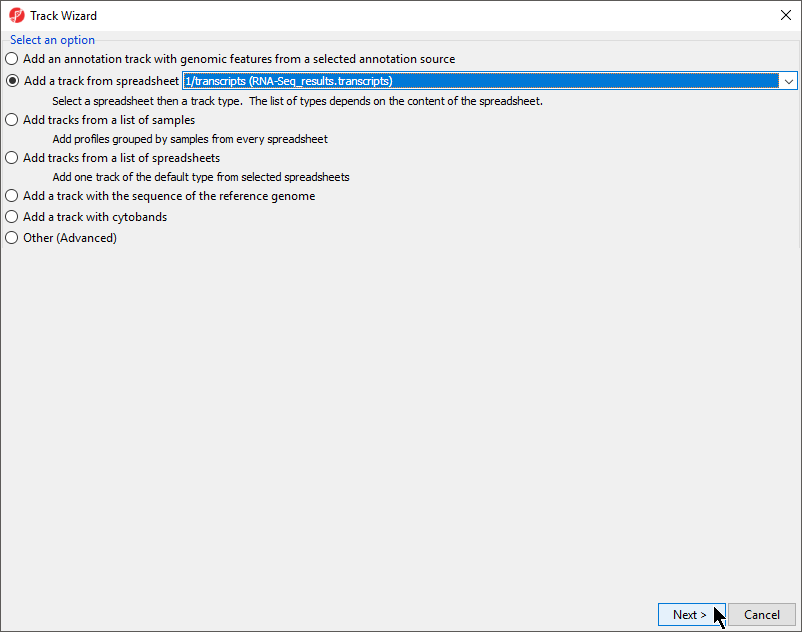
- With the transcripts spreadsheet selected, select Plot Chromosome View under the Visualization section of the RNA-Seq workflow to launch the Genome Viewer tab with the analyzed results Select New Track
- Select Add a track from spreadsheet and select 1/transcripts (RNA-Seq_results.transcripts) from the drop-down menu
- Select Next > (Figure 1)
| Numbered figure captions | ||||
|---|---|---|---|---|
| ||||
|
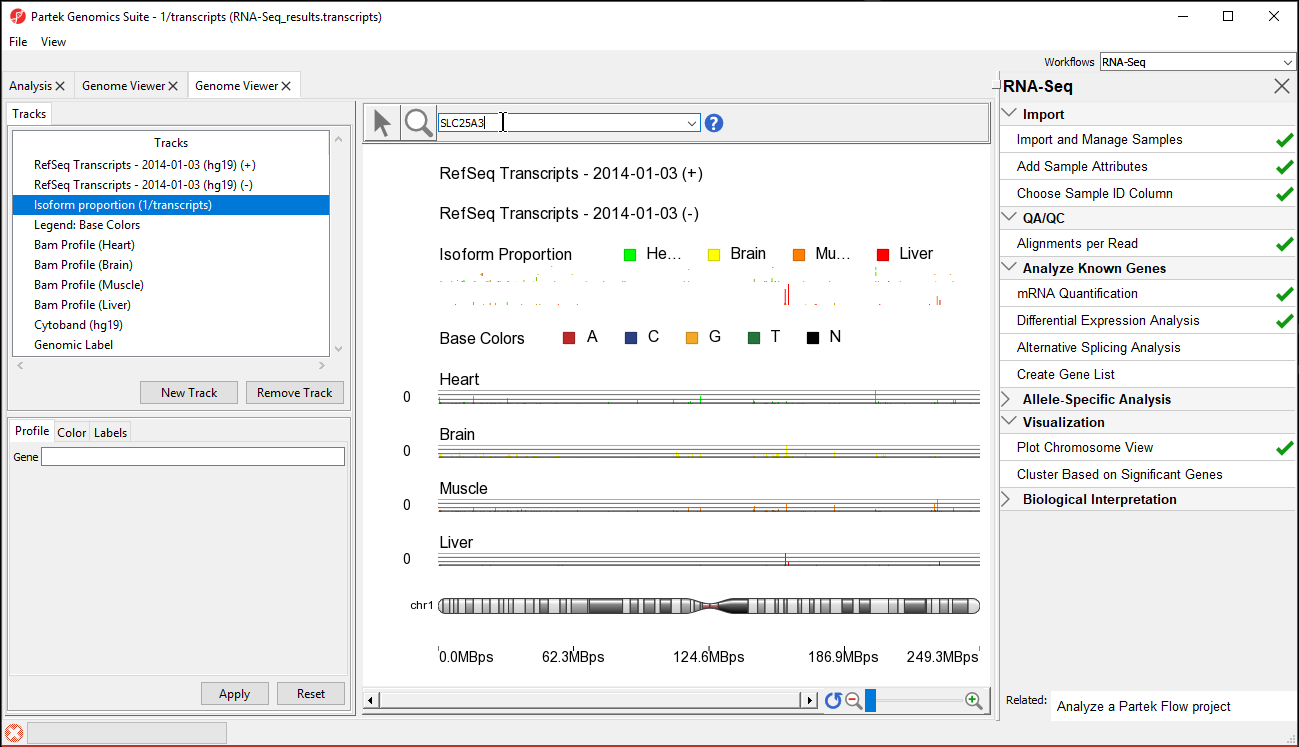
The viewer is almost identical to that seen after importing the aligned reads; the difference is the inclusion of the Isoform Proportions track (highlighted in the Tracks list in Figure 1). Next, we are going to view a single gene, SLC25A3, with differentially expressed isoforms.
...
|
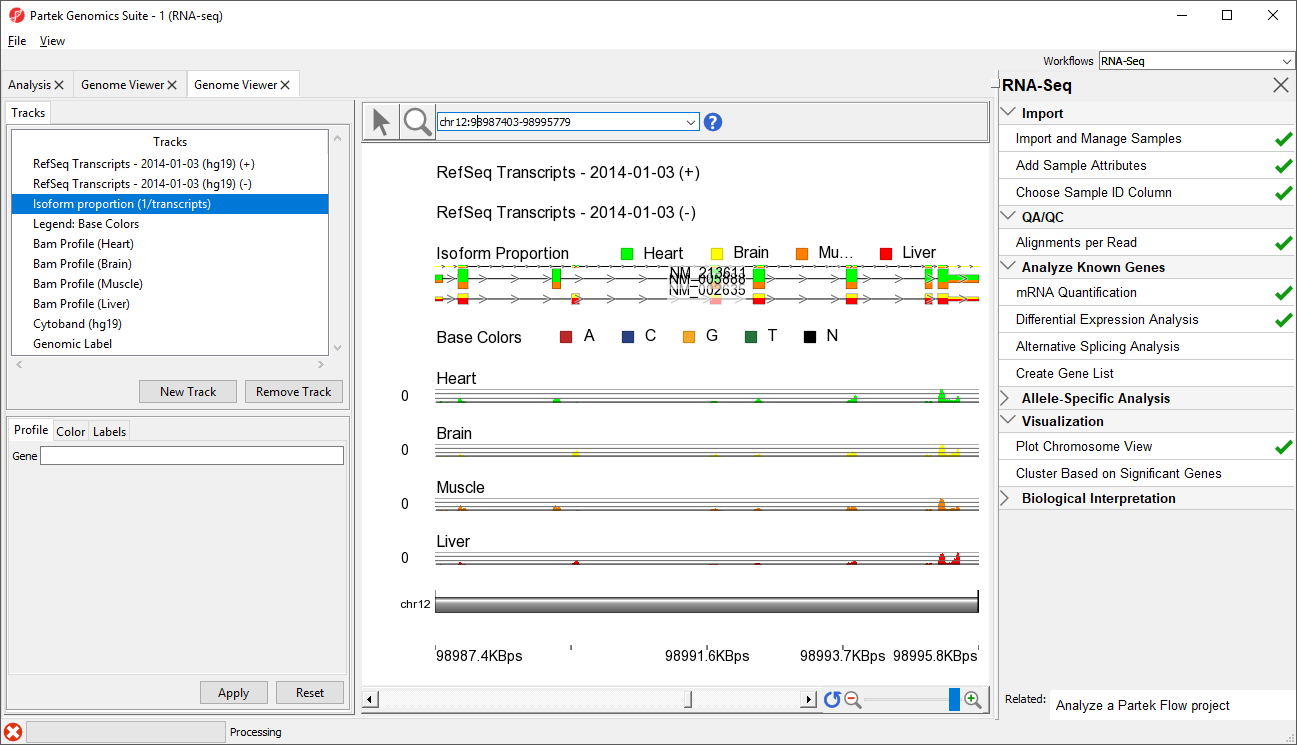
The new track will be added to Chromosome View (Figure 2).
| Numbered figure captions | ||||||
|---|---|---|---|---|---|---|
|
| |||||
|
At this point, you may find it useful to alter track properties. Each track can be individually configured. For example, isoform information will be easier to visualize if we remove a few tracks.
- Select Select Cytoband (hg19) in in the Tracks panel
- Select Remove Track to to remove it form the viewer
- Repeat for Genomic for Genomic Label, RefSeq Transcripts - 20142017-0105-03 02 (ht19hg19) (-), and Legend: Base Colors, and Genome Sequence
Next, we are going to view a single gene, SLC25A3, with differentially expressed isoforms.
- Type SLC25A3 in the Plot Position bar at the top of the window and hit Enter. The browser will browse to the gene
To further improve our visualization of SLC25A3 isoforms, we can also modify the remaining tracks.
- Select RefSeq Transcripts - 2014-01-03 (hg19) (+) from the Tracks panel
- Change Track height to 60 using the slider
- Select Apply to change track height
- Repeat steps to set each Bam Profile track to a height of 40 to complete our changes changes
- Move the Isoform proportion track to below the RefSeq Transcripts track by selecting and dragging it up the list (Figure 3)
| Numbered figure captions | ||||
|---|---|---|---|---|
| ||||
|
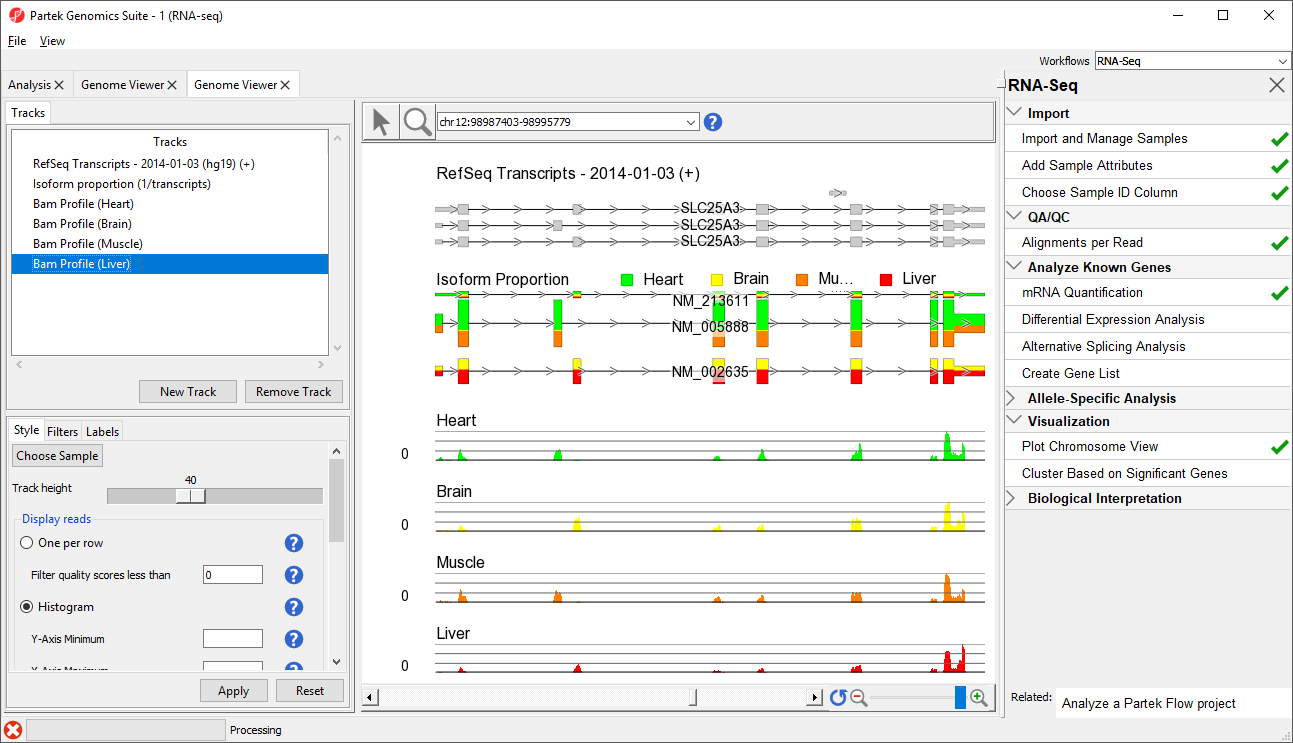
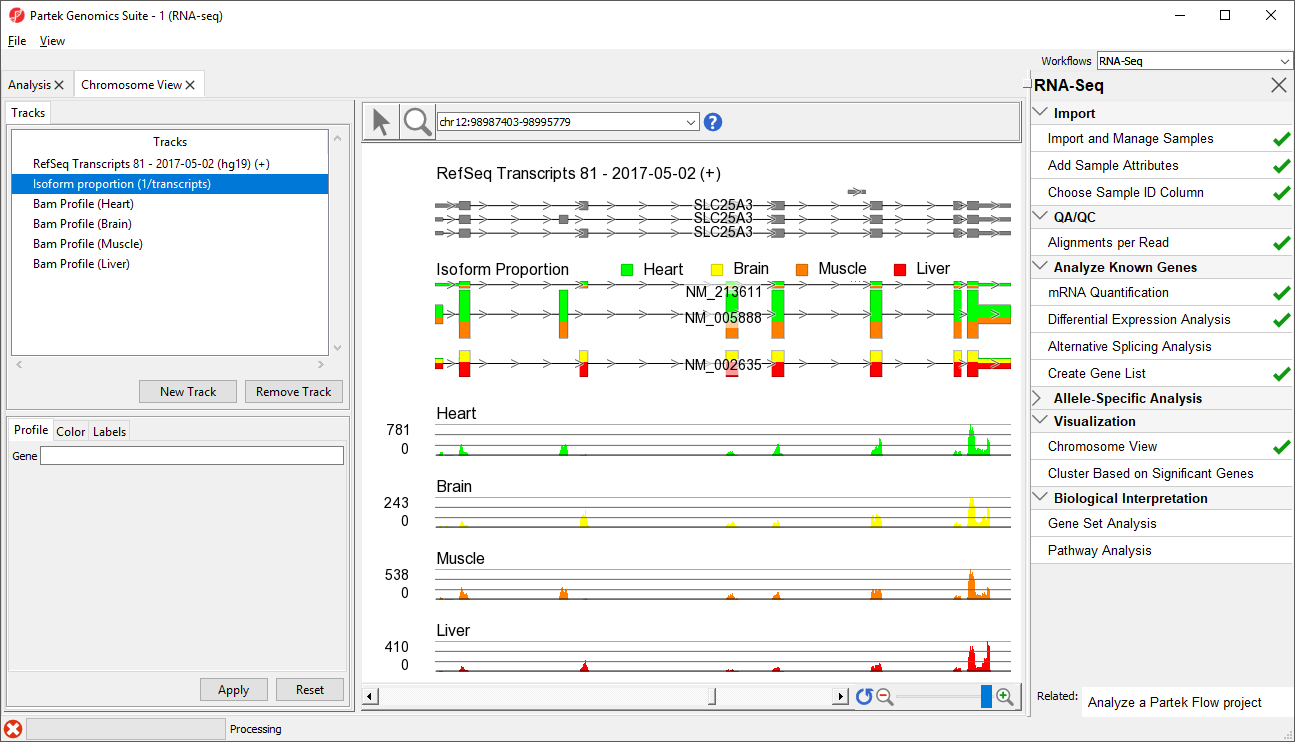
The Muscle, Brain, Heart, Liver, and genomic label tracks were described in a previous section. Here, the focus is on the Isoform proportion track, which visualizes differential expression and alternative splicing. The reads that are mapped to a certain sample and the proportion of the transcript expressed in that sample are colored to match the Bam Profile track of that sample. In this screenshot, Brain is yellow, Heart is green, Liver is red, and Muscle is orange
...
For additional tips on using the Genome Viewer Chromosome View, refer to Visualizing mapped reads with Genome ViewerChromosome View.
References
Wang, E.T., Sandberg, R., Luo, S., Khrebtukova, I., Zhang, L., Mayr, C., Kingsmore, S.F., Schroth, G.P., & Burge, C.B. Alternative isoform regulation in human tissue transcriptomes. Nature, 2008; 456: 470-6.
...
Overview
Content Tools