Page History
...
Unless you have previously downloaded an annotation file (during another experiment), you will be prompted to select an annotation source.
- Select RefSeq Transcripts - 20142017-0105-03 02
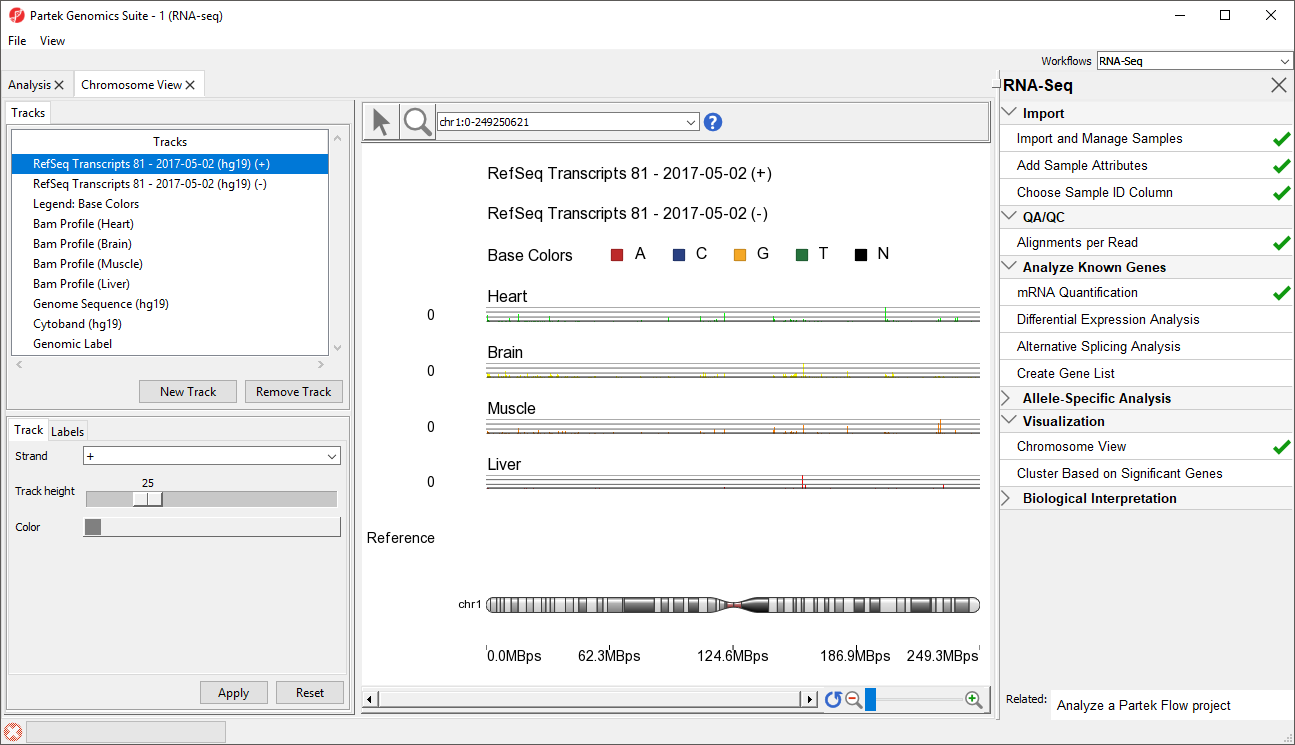
Partek Genomics Suite will download the relevant file and save it to your default library location. The Chromosome View tab will open with chromosome 1 displayed (Figure 1)
...
| Numbered figure captions | ||||
|---|---|---|---|---|
| ||||
|
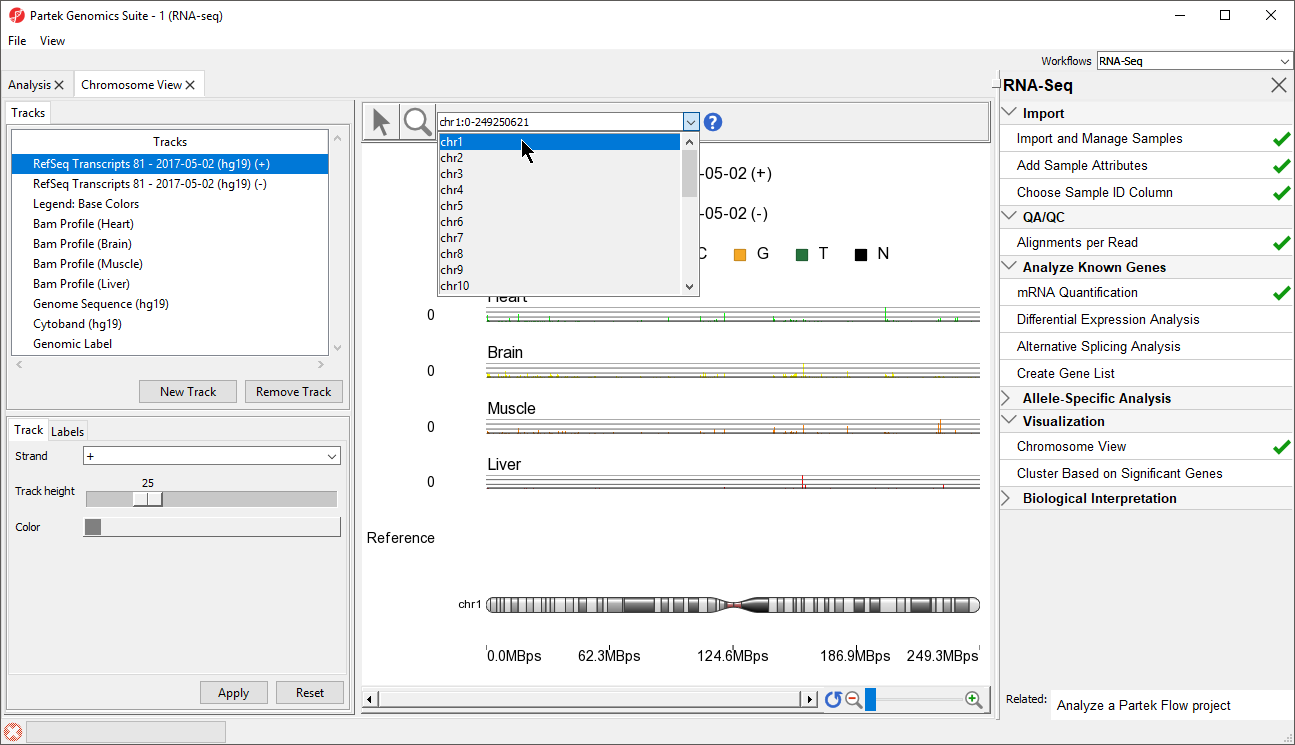
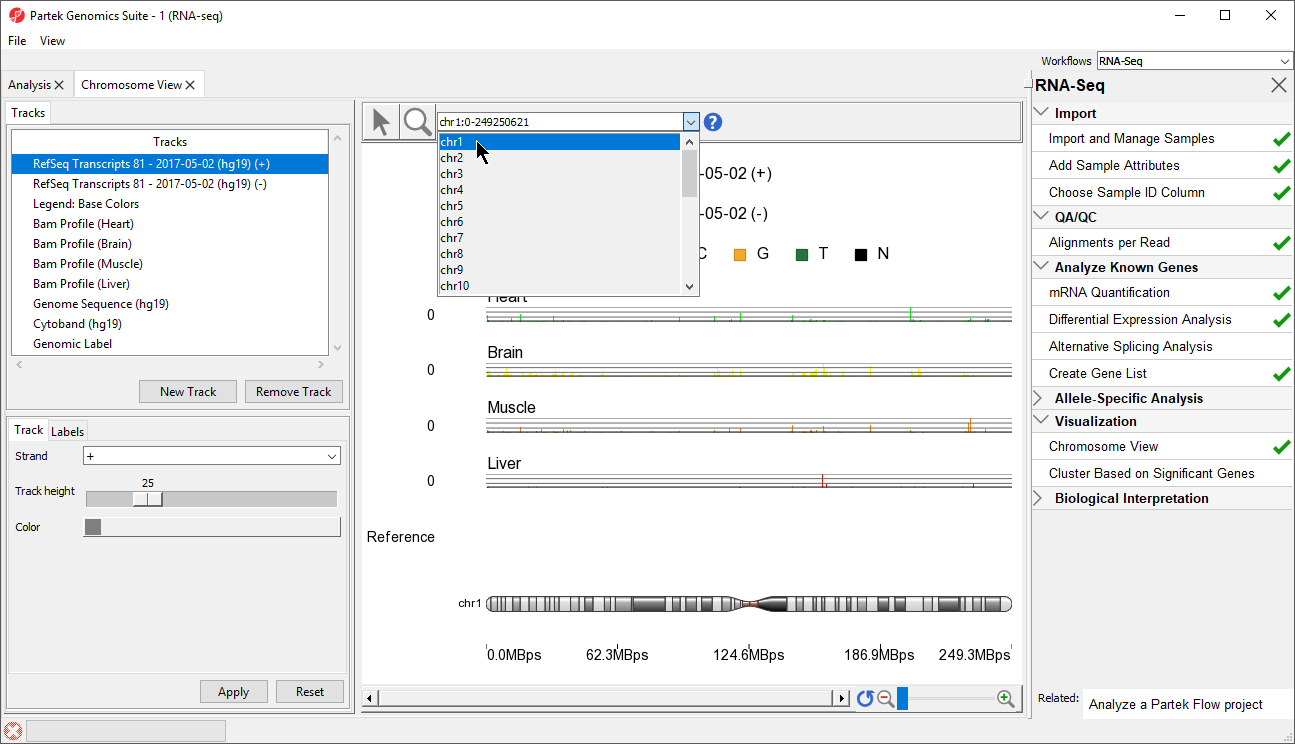
In Chromosome View you can choose other chromosomes from the position field drop-down menu (Figure 2) to change which chromosome is displayed. You may also type a search term (e.g. gene symbol or transcript ID) directly into the position field.
...
| Numbered figure captions | ||||
|---|---|---|---|---|
| ||||
|
The New Track button allows new tracks to be added to the viewer, while the Remove Track button removes the selected track from the viewer. Tracks can be reordered by selecting a track in the Tracks panel and dragging it up or down to move it in the list. In Chromosome View, select (![]() ) for selection mode and (
) for selection mode and (![]() ) for navigation mode. In navigation mode, left-click and draw a box on any track to zoom in. All tracks are synced and will zoom together. Zooming can also be controlled using the interface in the lower right-hand corner of the tab (
) for navigation mode. In navigation mode, left-click and draw a box on any track to zoom in. All tracks are synced and will zoom together. Zooming can also be controlled using the interface in the lower right-hand corner of the tab ( ). View can be reset to the whole chromosome level using reset zoom (
![]() ). Searching for a gene or transcript will also zoom directly to its location.
). Searching for a gene or transcript will also zoom directly to its location.
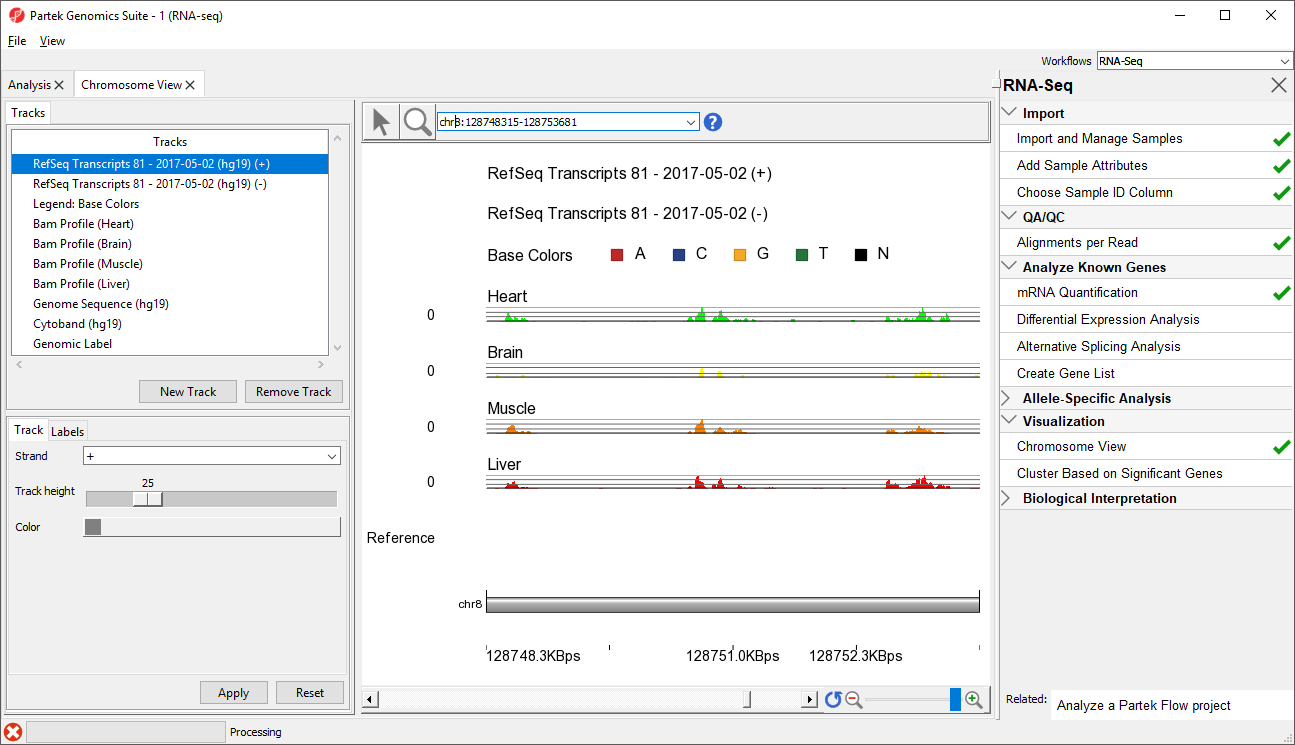
- Type MYC into the position field at the top of the window
The viewer is now zoomed in to the MYC gene locus (Figure 3).
| Numbered figure captions | ||||
|---|---|---|---|---|
| ||||
|
...
|
The Tracks panel contains the following tracks:
...
The RefSeq Transcripts (+) track shows all genes encoded on the forward strand of the currently selected chromosome. This experiment uses RefSeqGeneRefSeq Transcripts, which defines genomic sequences of well-characterized genes, as the reference annotation track. Mouse-over a particular region in this track, and all genes within this region are shown in the information bar. Zoom in on this track to see individual genes, including alternative isoforms.
...
The Bam Profile tracks show all the reads that mapped to the currently selected chromosome from the four tissue samples. The y-axis numbers on the left side of the tracks indicate the raw read counts. The aligned reads are shown in the Genome Viewer in each track with a different color for each Bam Profile track.
Genome Sequence, Cytoband, and Genomic Label
The Genome Sequence, Cytoband and Genomic Label tracks are shown at the bottom of the panel. These labels are helpful for navigating the chromosome.
| Page Turner | ||
|---|---|---|
|
...
Overview
Content Tools