Page History
...
- Open Partek Genomics Suite, choose File>Open.. from the main menu to open the trainingSet.fmt.
- Select Tools > Predict > Model Selection from the Partek main menu
- In Cross-Validation tab, choose to Predict onType, Positive Outcome is Disease, Selection Criterion is Normalized Correct Rate (Figure 1)
- Choose 1-Level Cross-Validation option, and use Manually specify partition option as 5– use 1-level cross validation option is to select the best model to deploy
...
- Choose Variable Selection tab, to use ANOVA to select variables. The number of genes selected are based on the p-value generated from the 1-way ANOVA model which factor is Type. In each iteration of cross validation, we will use the training set to perform ANOVA, take the top N number of genes with the most significant p-values to build the classifier. The Configure button allow you to specify ANOVA model if you want to include multiple factors (Figure 2).
- Since we don't know how many genes should be used to build the model, we will try to use 10, 20, 30, 40, 50 genes – the more options you try, the longer time it takes to run. In the How many groups of variables do you want to try, select Multiple groups with size from 10 to 50 step 10
...
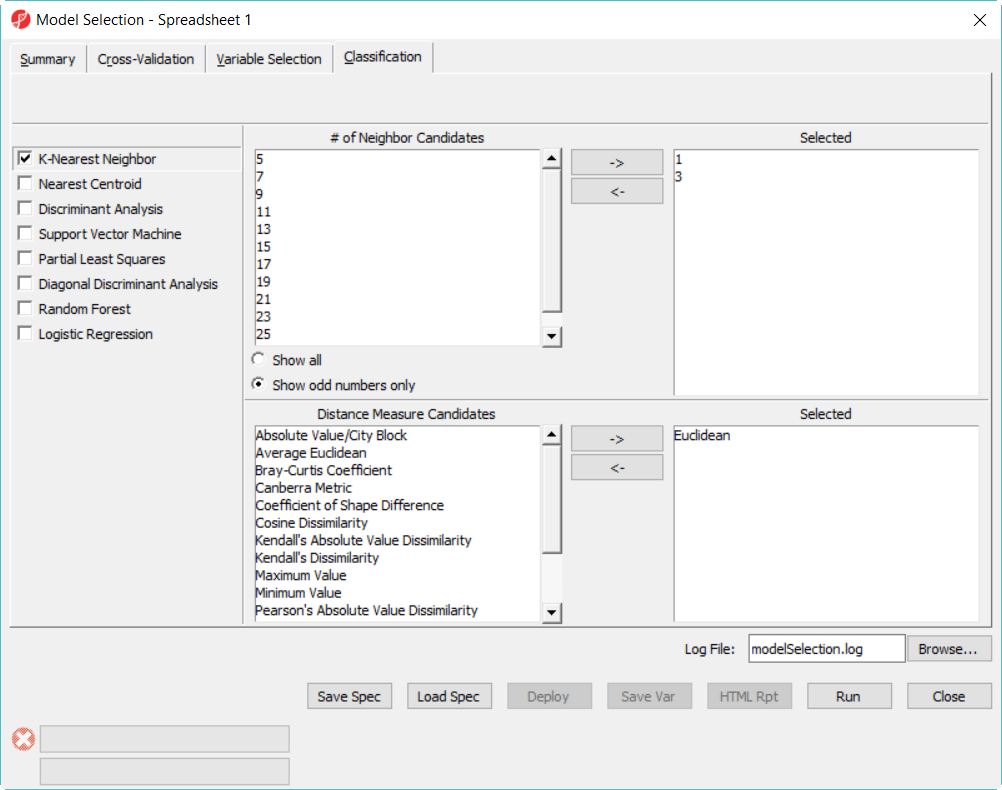
- Click on Classification tab, select K-Nearest Neighbor, choose 1 and 3 neighbors using default Euclidean distance measure (Figure 3)
| Numbered figure captions | ||||
|---|---|---|---|---|
| ||||
|
- Select Discriminant Analysis option, use the default setting which has the Linear with equal prior probabilities option checked
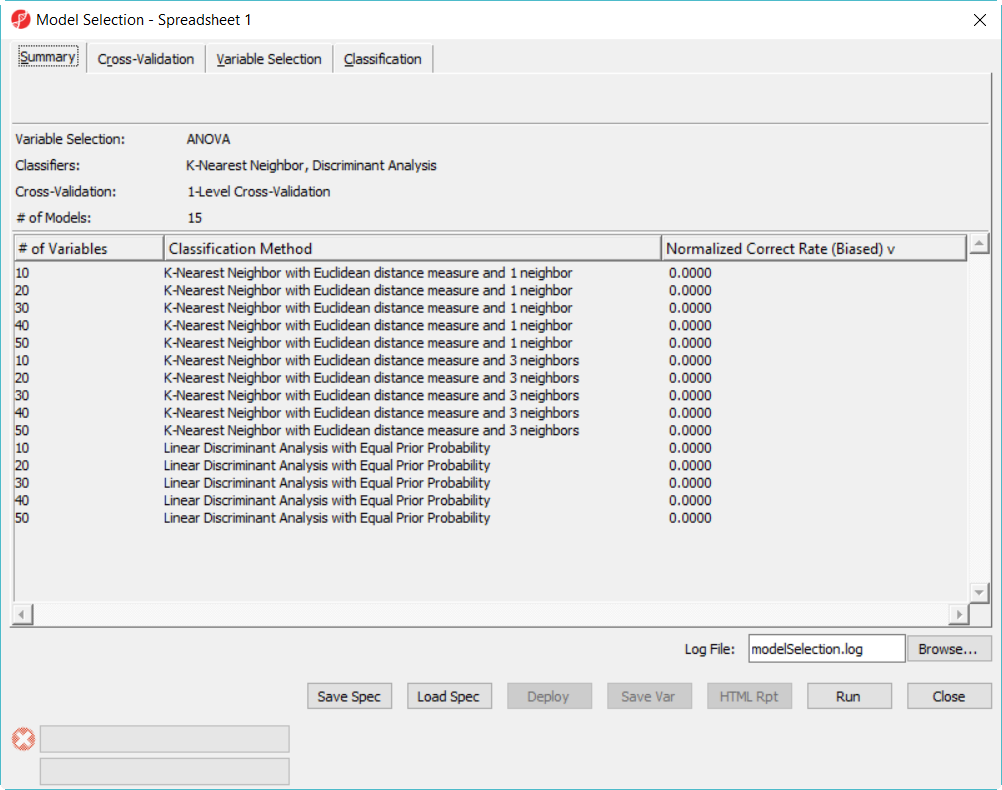
- Click on Summary tab, we have configured 15 models to choose from (Figure 3)
| Numbered figure captions | ||||
|---|---|---|---|---|
| ||||
|
When click on Run, a dialog as (Figure 4) will display, some classifiers like discriminant analysis are not recommended to perform on dataset with more number of variables than that of samples.
...
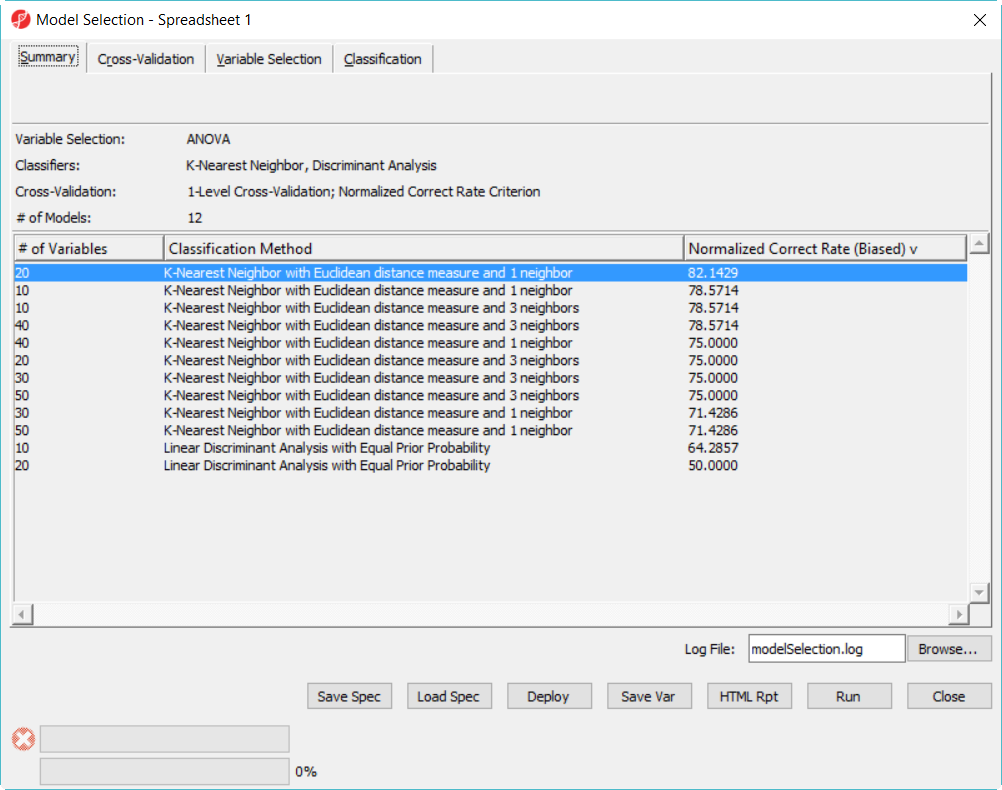
Since we are doing 5-fold cross validation, there will be 6 samples held out as test set in each iteration, and the models are built on the rest 22 samples training set. After it is done, all the 12 models have been tested on the 28 samples, and the correct rate will reported, they are displayed in the summary page in descending order of the normalized correct rate, the top one is the best model among the 12 models (Figure 5).
| Numbered figure captions | ||||
|---|---|---|---|---|
| ||||
|
...
- Choose File>Open... to open to browse and open testSet.fmtChoose
- Choose Tools>Predict>Run Deployed Model... from the menu
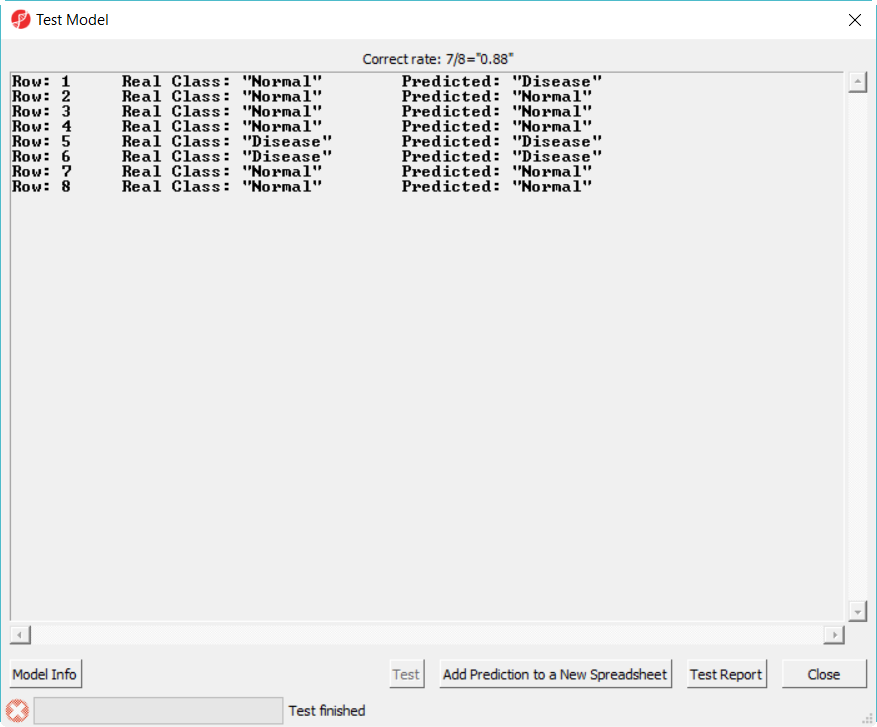
- Select 20var-3NN-Euclidean.ppb to open, click on Test button to run, the correct rate is reported on the top of the dialog (Figure 6)
| Numbered figure captions | ||||
|---|---|---|---|---|
| ||||
|
Cross validation
Common mistakes
...
Overview
Content Tools