Join us for an event September 26!
How to Streamline RNA-Seq analysis and increase productivity—point, click, and done
Page History
...
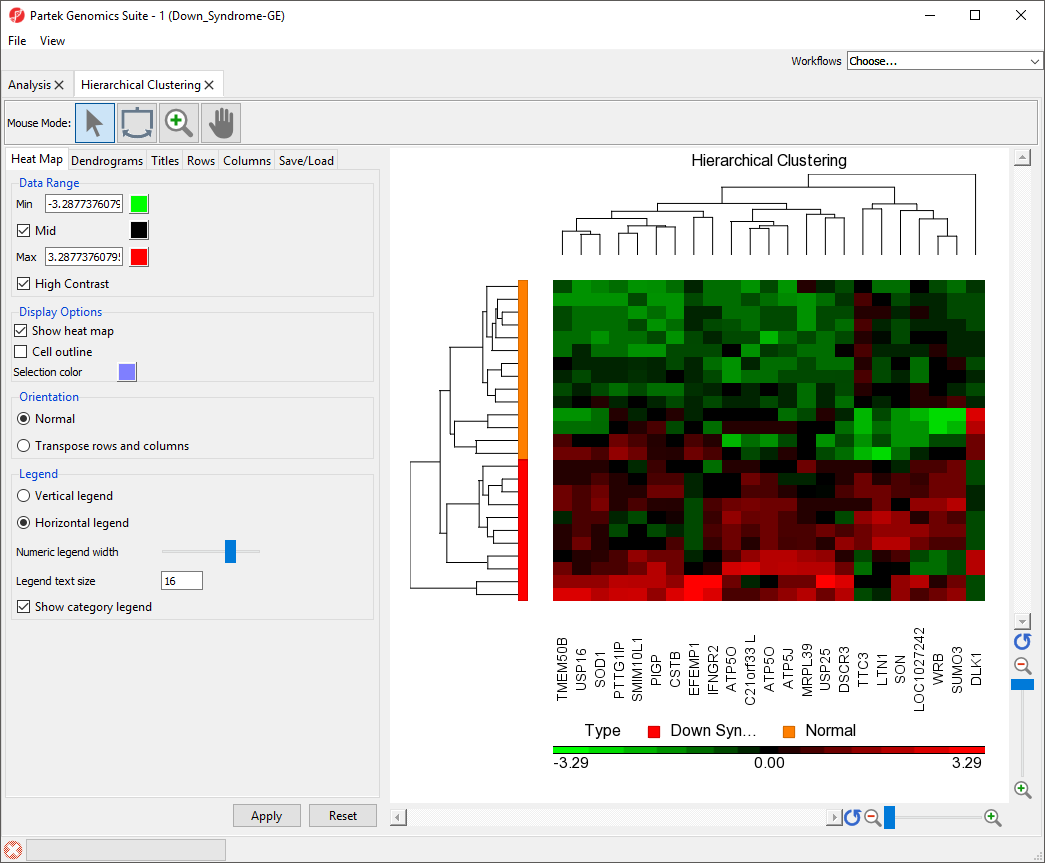
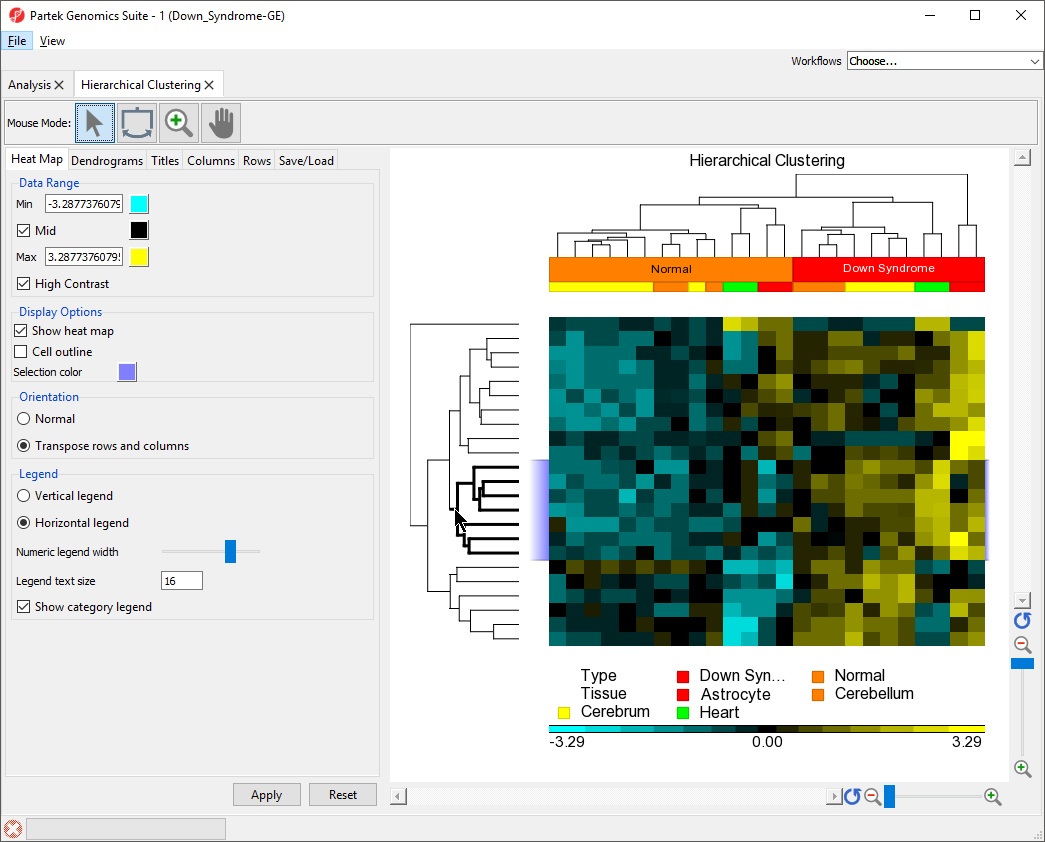
To illustrate the capabilities and customization options of hierarchical clustering in Partek Genomics Suite, we will explore an example of hierarchical clustering drawn from the tutorial Gene Expression Analysis. The data set in this tutorial includes gene expression data from patients with or without Down syndrome. Using this data set, 23 highly differentially expressed genes between Down syndrome and normal patient tissues were identified. These 23 differentially regulated genes were then used to perform hierarchical clustering of the samples. Follow the steps outlined in Hierarchical Clustering and Adding Information to Gene Lists to perform hierarchical clustering and launch the Hierarchical Clustering tab (Figure 1).
| Numbered figure captions | ||||
|---|---|---|---|---|
| ||||
|
...
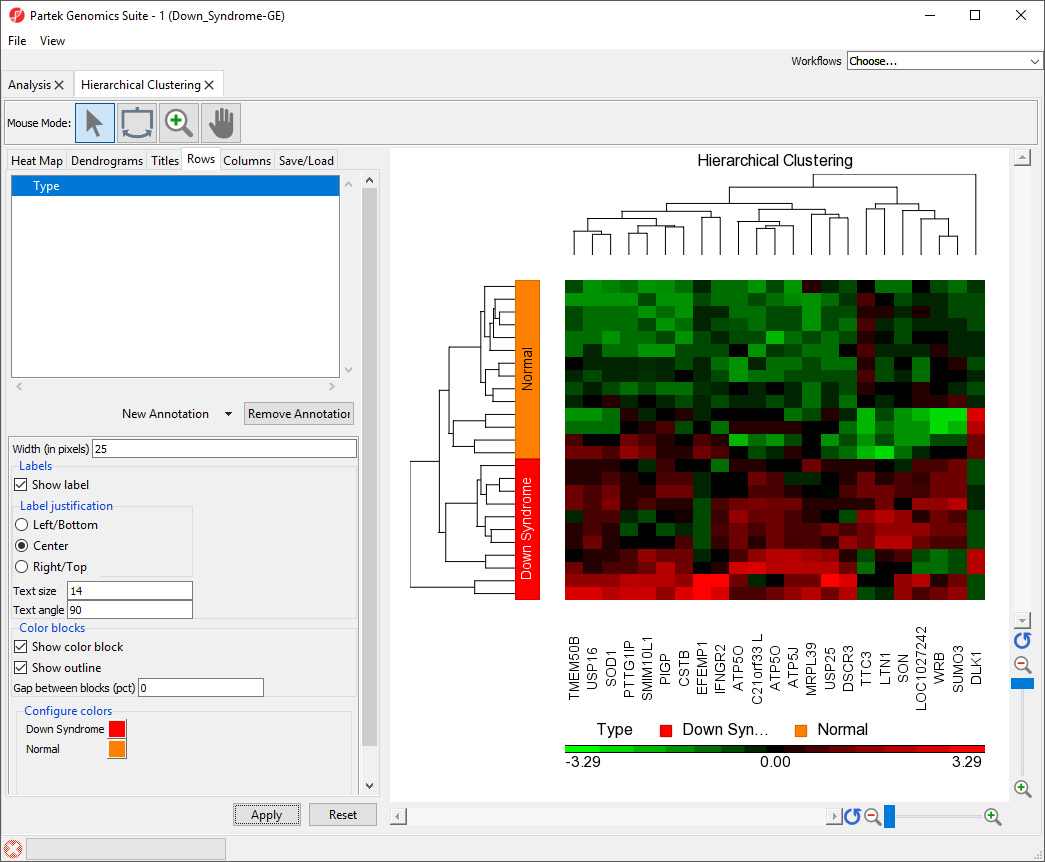
The sample attributes are now labeled with group titles (Figure 2).
| Numbered figure captions | ||||
|---|---|---|---|---|
| ||||
|
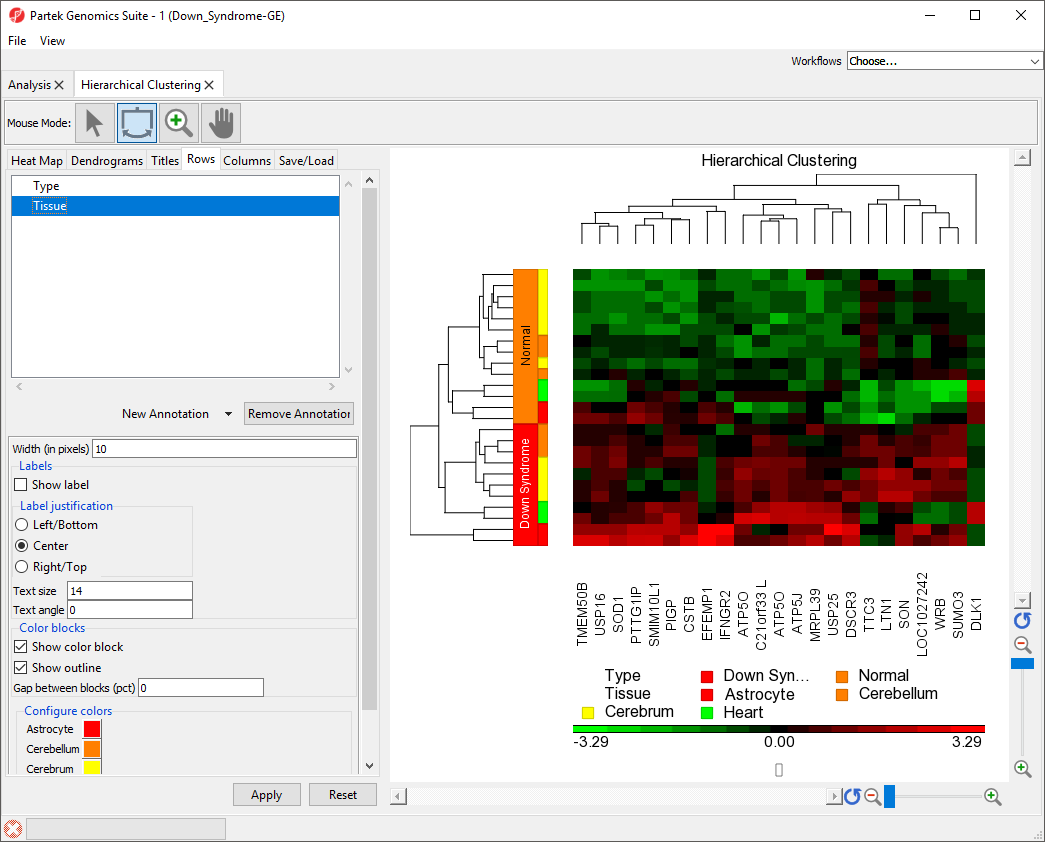
Adding a Sample Attribute to the Heat Map
...
Color blocks indicating the tissue of each sample have been added to the row labels and sample legend (Figure 3).
| Numbered figure captions | ||||
|---|---|---|---|---|
| ||||
|
...
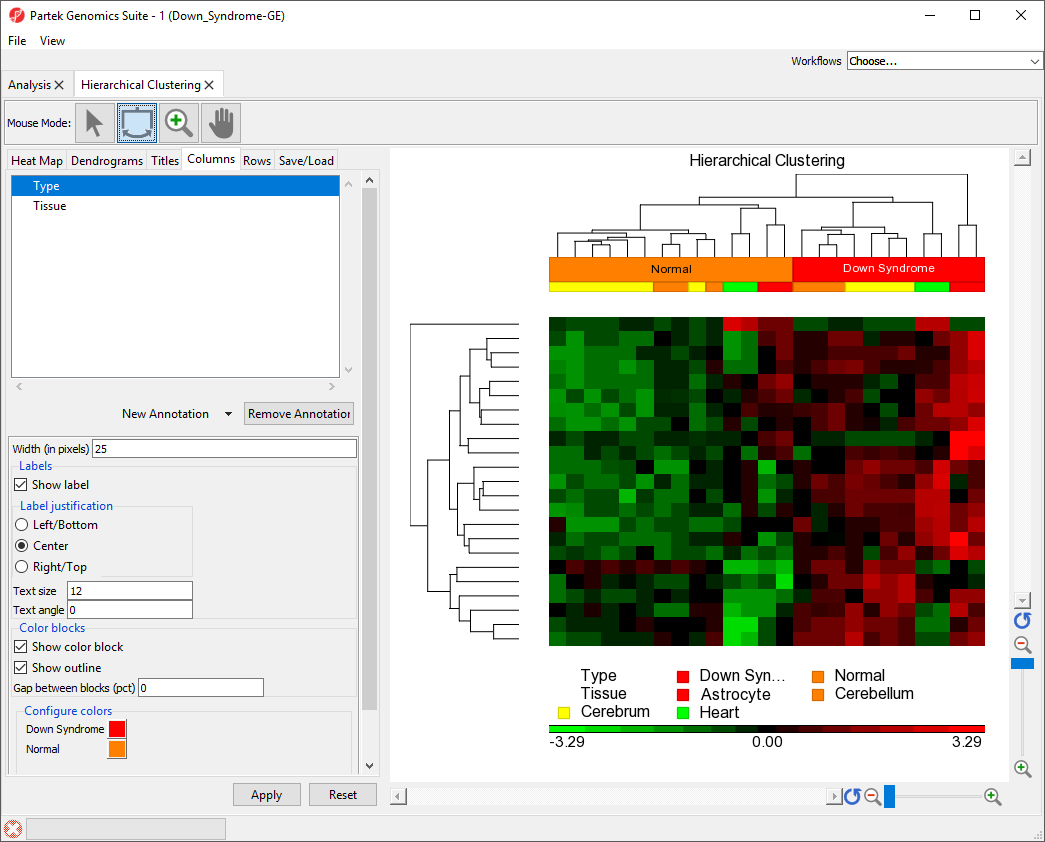
The bottom row has moved to the top of the heat map (Figure 5).
| Numbered figure captions | ||||
|---|---|---|---|---|
| ||||
|
Changing Heat Map Colors
The minimum, maximum, and midpoint colors of the heart map intensity plot can be customized.
...
The selected dendogram column will be in bold and the selected rows will be highlighted.
| Numbered figure captions | ||||
|---|---|---|---|---|
| ||||
|
...
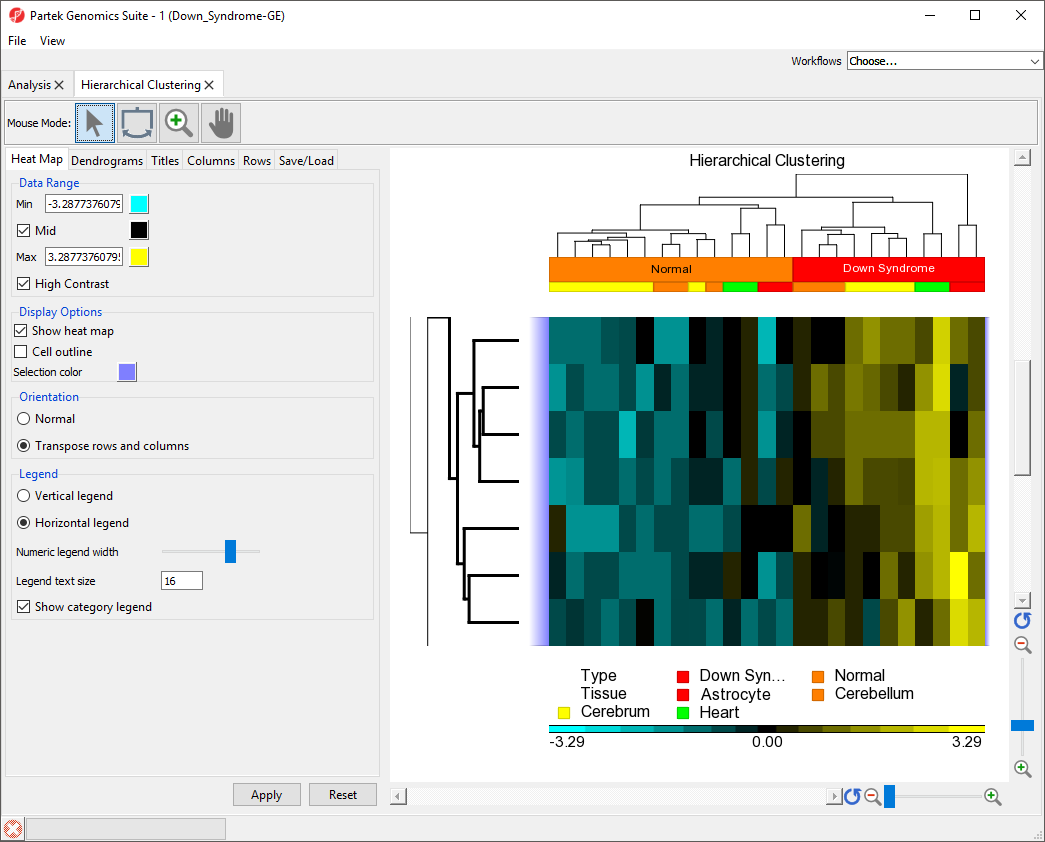
The same steps can be used to zoom into columns or rows. Here, we have zoomed in on the rows, but not columns to show the expression levels of the selected genes for all samples (Figure 8).
| Numbered figure captions | ||||
|---|---|---|---|---|
| ||||
|
To reset zoom select (![]() ) on the x-axis to show all columns and the y-axis to show all rows
) on the x-axis to show all columns and the y-axis to show all rows
...
Overview
Content Tools