Page History
...
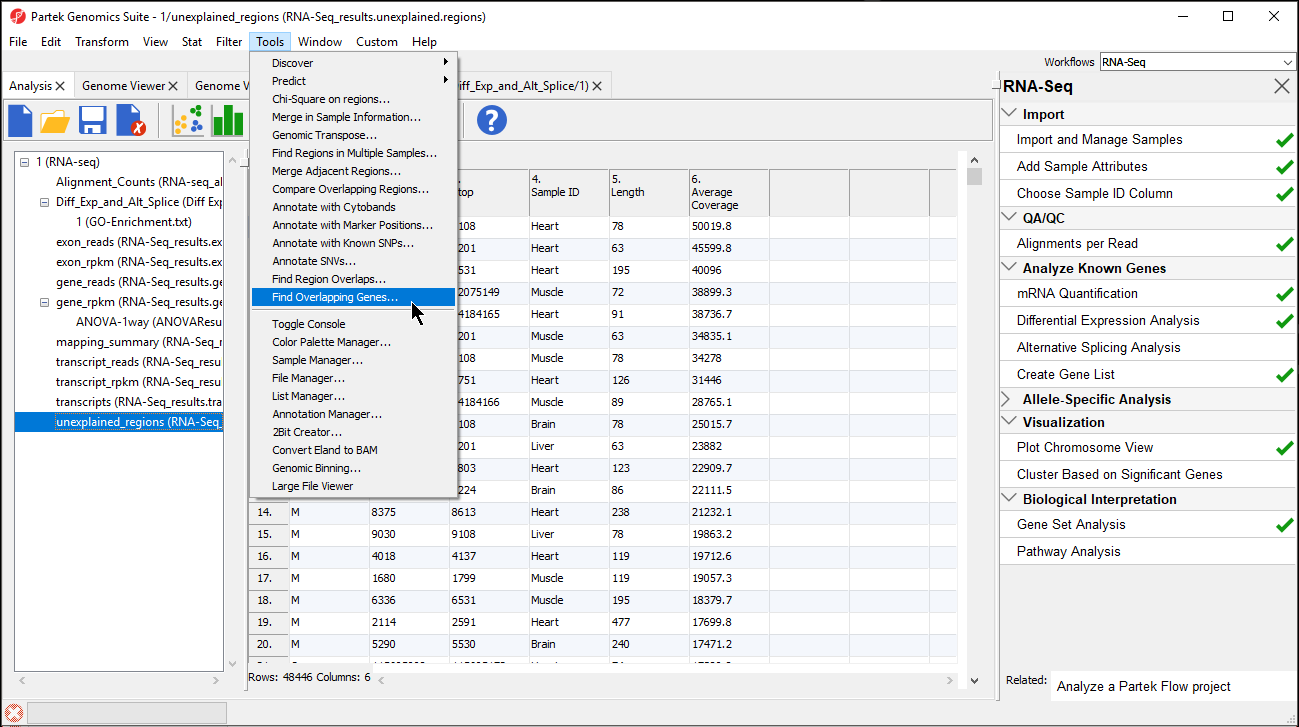
- Right click column 6. Average Coverage and select Sort Descending from the menu
- Select Find Overlapping Genes from the Tools option in the command toolbar (Figure 1)
| Numbered figure captions | ||||
|---|---|---|---|---|
| ||||
|
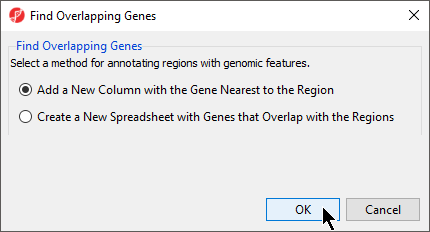
- Select Add a new column with the gene nearest to the region in the Find Overlapping Genes dialog (Figure 2)
- Select OKOK
| Numbered figure captions | ||||
|---|---|---|---|---|
| ||||
|
...
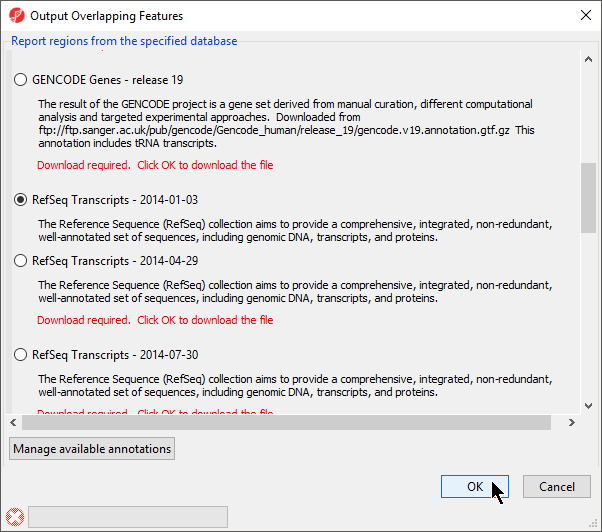
Please note that it is recommended that you annotate with the same database as when you performed mRNA quantification.
- Select OKOK
| Numbered figure captions | ||||
|---|---|---|---|---|
| ||||
|
...
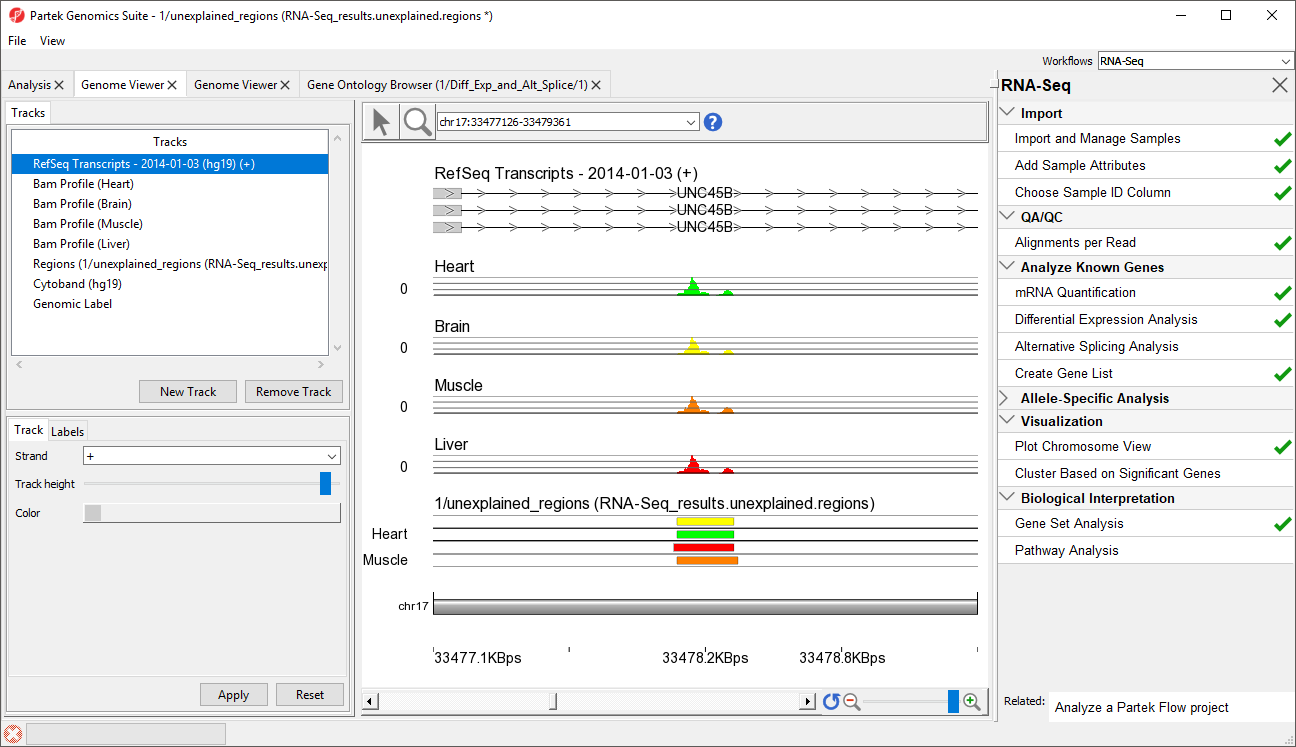
- Select row 45 and Browse to location to show a region within an intron of UNC45B. This may be a novel exon (Figure 6)
| Numbered figure captions | ||||
|---|---|---|---|---|
| ||||
|
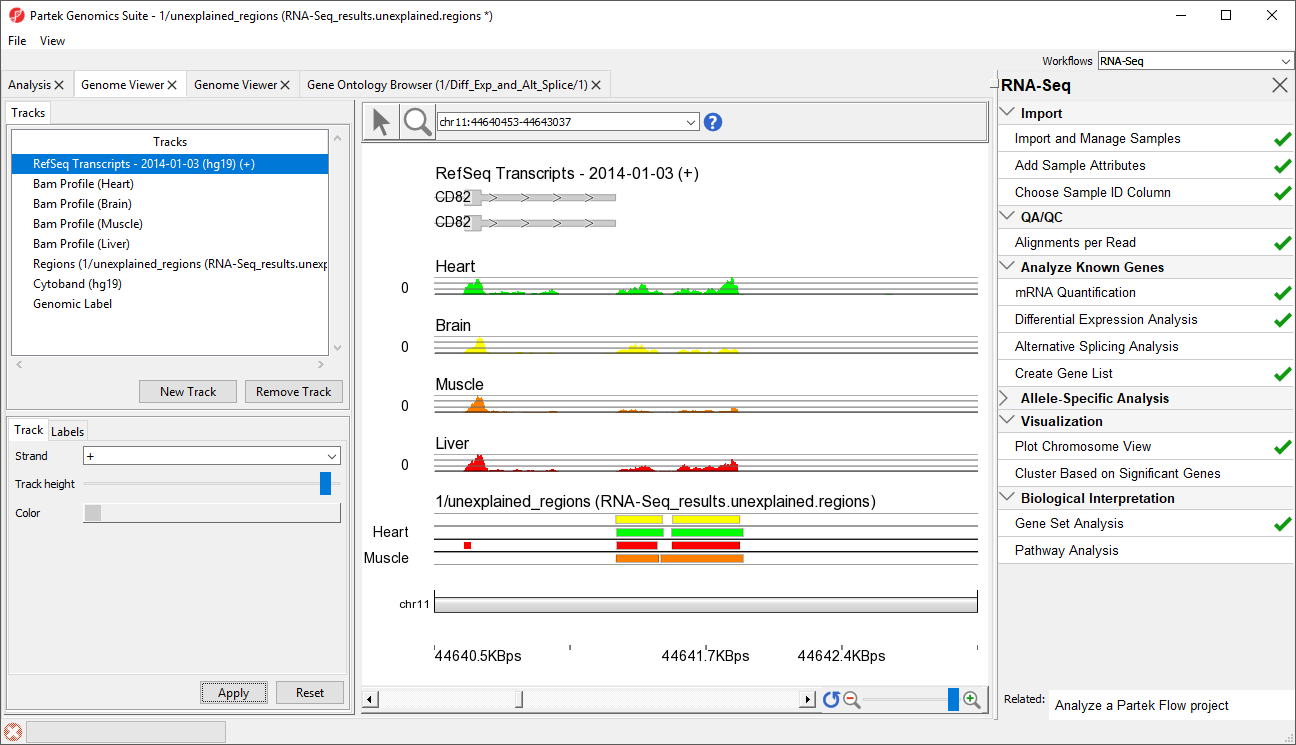
- Select row 10482 and Browse to location to show a region that starts 1 bp after CD82. This peak may represent an extended exon (Figure 7)
| Numbered figure captions | ||||
|---|---|---|---|---|
| ||||
|
...
Overview
Content Tools