Page History
...
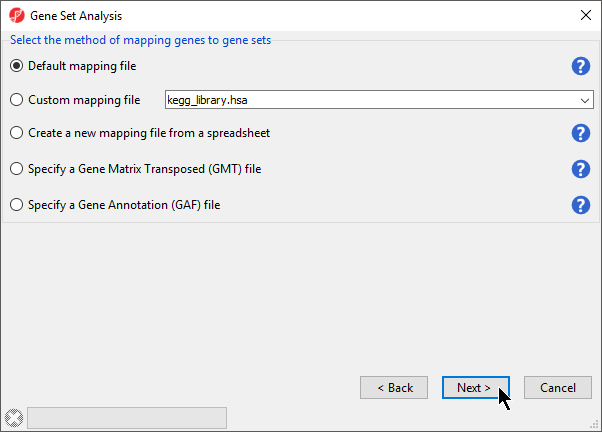
- Select Default mapping file (Figure 5)
- Select Next >
| Numbered figure captions | ||||
|---|---|---|---|---|
| ||||
|
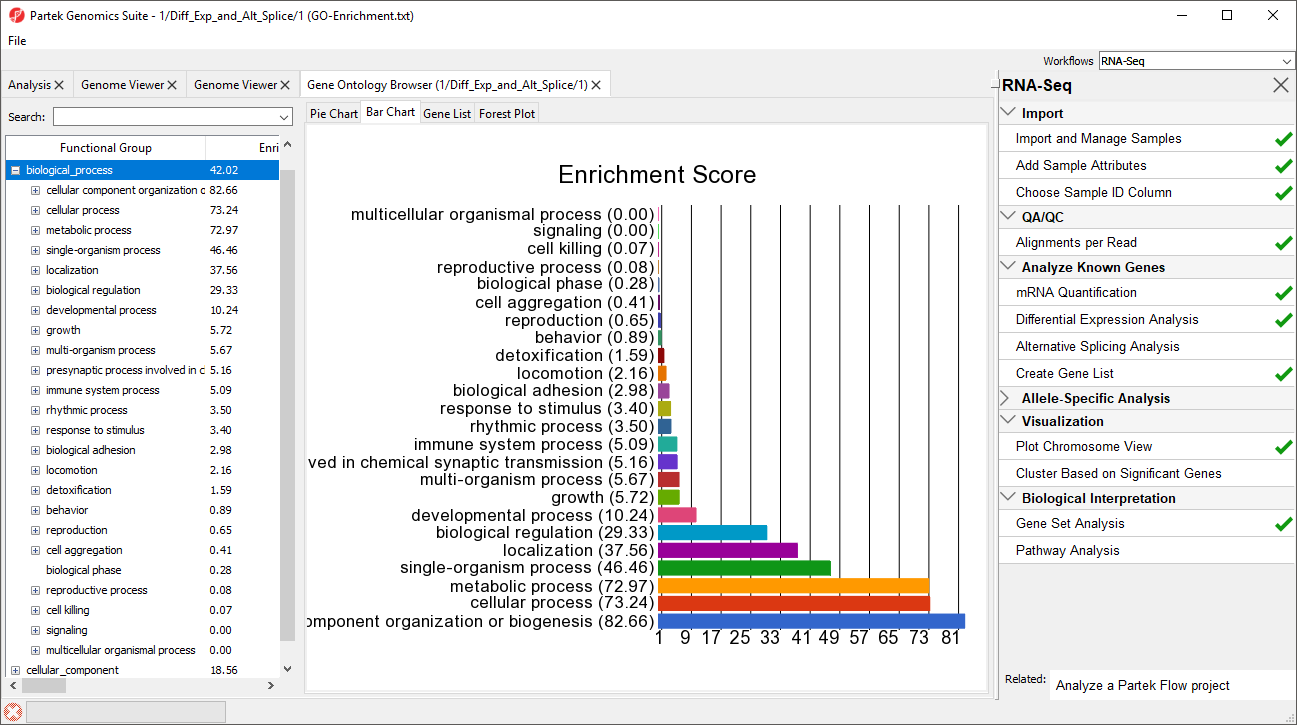
A GO-Enrichment spreadsheet, as well as a browser (Figure 6), will be generated with the enrichment score shown for each GO term. Browse through the results to find a functional group of interest by examining the enrichment scores. The higher the enrichment score, the more over represented this functional group is in the input gene list. Alternatively, you may use the Interactive filter on the GO-Enrichment spreadsheet to identify functional groups that have low p-values and perhaps a higher percentage of genes in the group that are present.
| Numbered figure captions | ||||
|---|---|---|---|---|
| ||||
|
| Page Turner | ||
|---|---|---|
|
| Numbered figure captions | ||||
|---|---|---|---|---|
| ||||
|
| Additional assistance |
|---|
|
| Rate Macro | ||
|---|---|---|
|
Overview
Content Tools