Page History
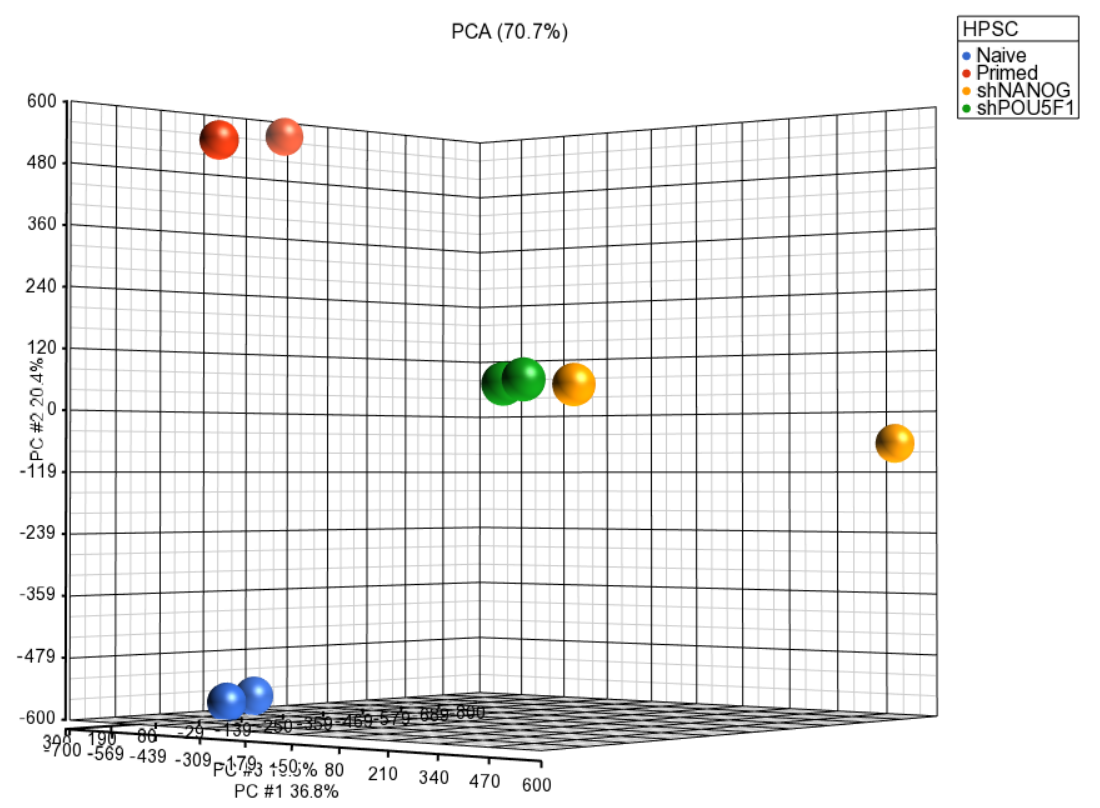
Principal component analysis (PCA) can be invoked on the methylation data to reveal clustering of the samples, but also as a quality control procedure (detection of outliers could point to possible low quality or mislabeled samples). To obtain the PCA plot, switch to the Scatter Plot tab, push Recompute ( ![]() ) and from the Color by drop down list select HPSC. Use the Rotate Mode (
) and from the Color by drop down list select HPSC. Use the Rotate Mode (![]() )to explore the plot from different angles, as shown in Figure 1.
)to explore the plot from different angles, as shown in Figure 1.
| Numbered figure captions | ||||
|---|---|---|---|---|
| ||||
|
...
Overview
Content Tools