What is Gene set enrichment?
Enrichment analysis is a technique commonly used to add biological context to a list of genes, such as list of significant genes filtered from differential analysis report. The procedure is based on assigning genes to groups and then finding overrepresented groups in filtered gene lists using a Fisher's exact test.
Running Gene set Enrichment
Gene set enrichment task can be invoked on a differential analysis output (or filtered differential analysis output) data node or filtered count matrix data node. Since the data node including all the features will serve as background, to get a meaningful result, always use a data node containing subset of features to invoke this task. Only gene names will be used in the computation.
- Click a Feature list data node
- Click the Biological interpretation section of the toolbox
- Click Gene set enrichment
- There are two options for Database. KEGG database requires a special license (Figure 1).
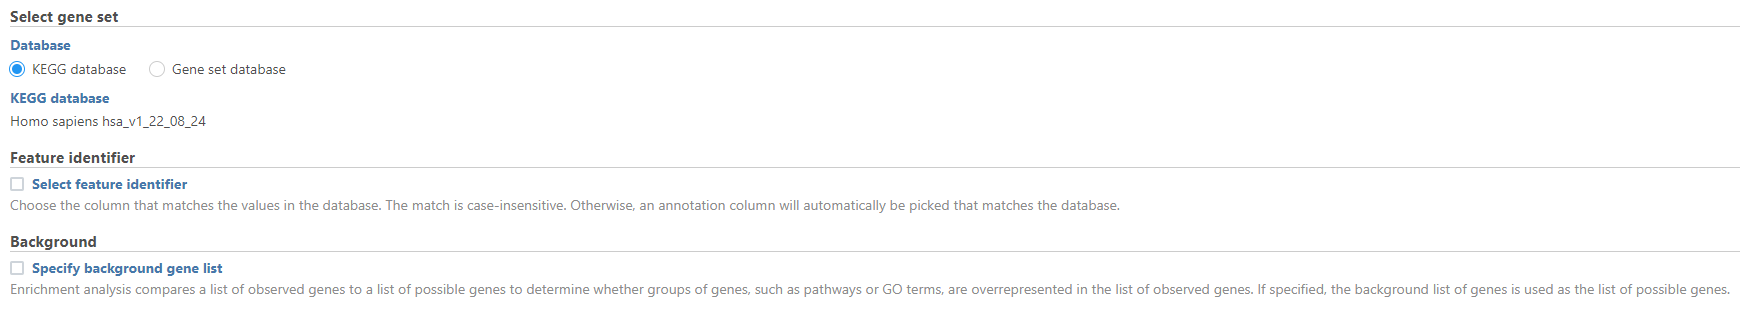
Figure 1. Selecting KEGG database
- Gene set database is user defined database, see more details in the Adding a Gene Set chapter. The gene sets available for the current Assembly are listed under the Gene set database drop-down list (Figure 2). The assembly is automatically selected, if possible. If the assembly cannot be detected, you can specify it using the drop-down.
Partek distributes Gene Ontology (GO) for human and mouse genomes, a bioinformatics initiative to unify the representation of gene and gene product attributes across various species [1, 2].
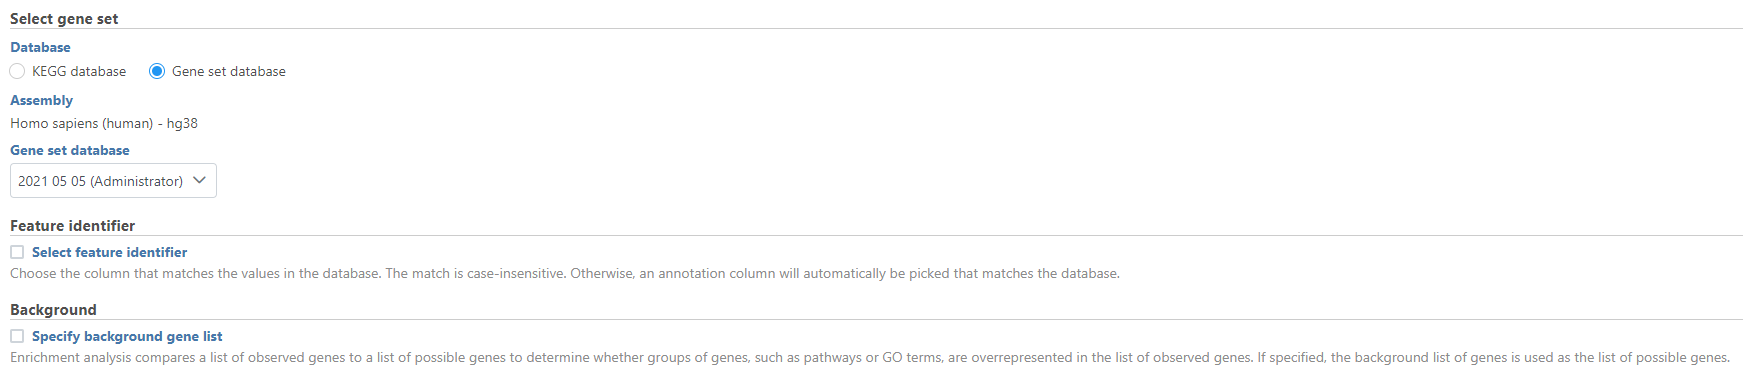
Figure 2. Selecting user defined gene set database
- Select feature identifier (optional) can be used to specify the feature format (e.g. Gene name, Gene ID, Feature ID).
- Specify the background gene list (optional) can be used for a feature list. Select the list using the drop-down. Click here for more information on List management.
The background gene list is used as the list of possible genes. By default, this is the genes included in the selected gene set database. If your assay limits the genes that could be detected, you may want to specify a background list.
- Click Finish to run
The result is stored under an Enrichment task node. To open it, double click on the node or select the respective Task report from the context sensitive menu.
Task report
Figure 3 shows an example Gene set enrichment task report using GO database. The table contains one gene set per row (Gene set column; the column entries are hyperlinks when using the distributed GO gene sets), with the category name in the Description column. The categories are ranked by the Enrichment score, which is the negative natural logarithm of the enrichment p-value (P-value column) derived from Fisher's exact test on the underlying contingency table. The higher the enrichment score, the more overrepresented the GO category is within the input list of significant genes. The columns can be searched by typing in the search term in the respective box (and hitting Enter), or sorted by selecting the double arrow icon ( ![]() ).
).
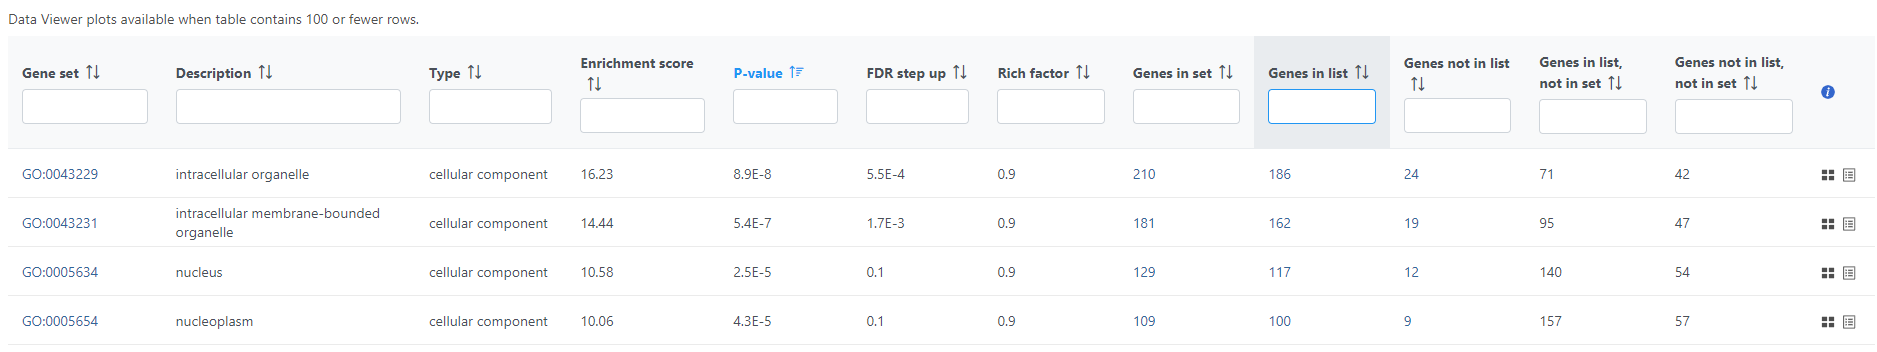
Figure 3. Go enrichment report (truncated). Gene set column contains Gene Ontology identifiers (hyperlinks). Category labels are in the Description column. Enrichment score: negative natural logarithm of the enrichment P-value derived from the Fisher's exact test. Genes in list: number of genes that are present both in the list of significant genes and the gene set (GO category). Genes not in list: number of genes that are present in the gene set, but are not present in the list of significant genes. The column on the right contains links to gene breakdown chart and extra details
The contingency table (Figure 4) can be displayed by selecting the View gene breakdown chart icon on the right (![]() ). The term "list" refers to the list of significant genes, while the term "set" refers to the respective GO category. The first row of the contingency table is also seen in the report, namely the Genes in list and Genes not in list columns.
). The term "list" refers to the list of significant genes, while the term "set" refers to the respective GO category. The first row of the contingency table is also seen in the report, namely the Genes in list and Genes not in list columns.
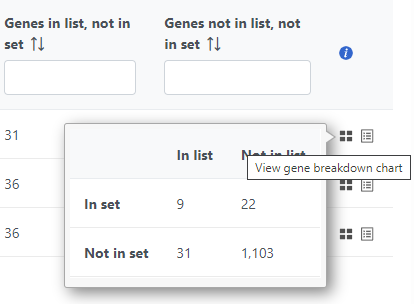
Figure 4. Contingency table used to calculate the enrichment p-value. List refers to the list of significant genes, set refers to the gene ontology category
The View extra details (![]() ) button provides additional information on the GO category (Figure 5). In addition to the details already given in the report, a full list of Genes in list and Genes not in list can be inspected and downloaded (Download data) to the local computer as a text file. Use the arrow to expand these sections.
) button provides additional information on the GO category (Figure 5). In addition to the details already given in the report, a full list of Genes in list and Genes not in list can be inspected and downloaded (Download data) to the local computer as a text file. Use the arrow to expand these sections.
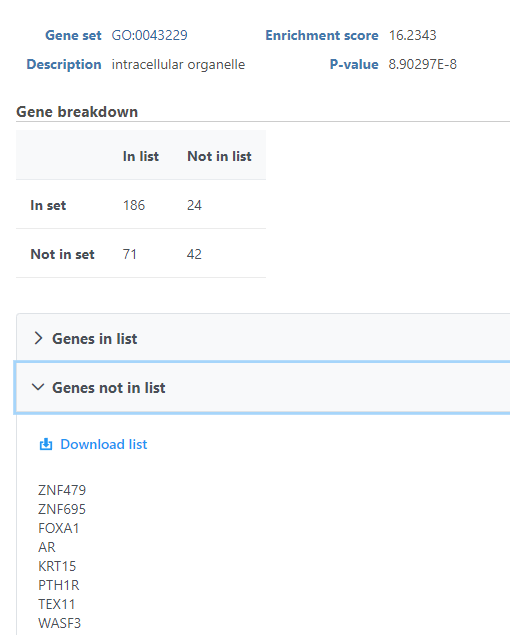
Figure 5. Gene ontology enrichment extra details
As previously mentioned, if you are using the GO gene sets distributed by Partek, the GO identifiers in the first column are hyperlinks to the Gene Ontology web-site entries (an example shown in Figure 6).
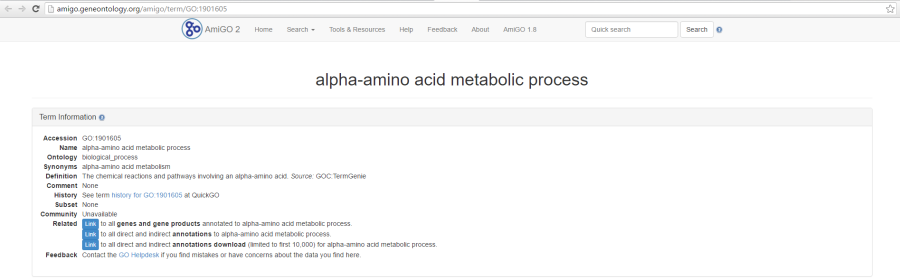
Figure 6. Selecting a GO category in the table report opens up a browser and displays additional information on that category via GO web-page
Interactive KEGG pathway maps
When KEGG database is used, on the enrichment task report, when click on a pathway ID in the Gene set column, a KEGG pathway gene network picture is displayed (Figure 7).
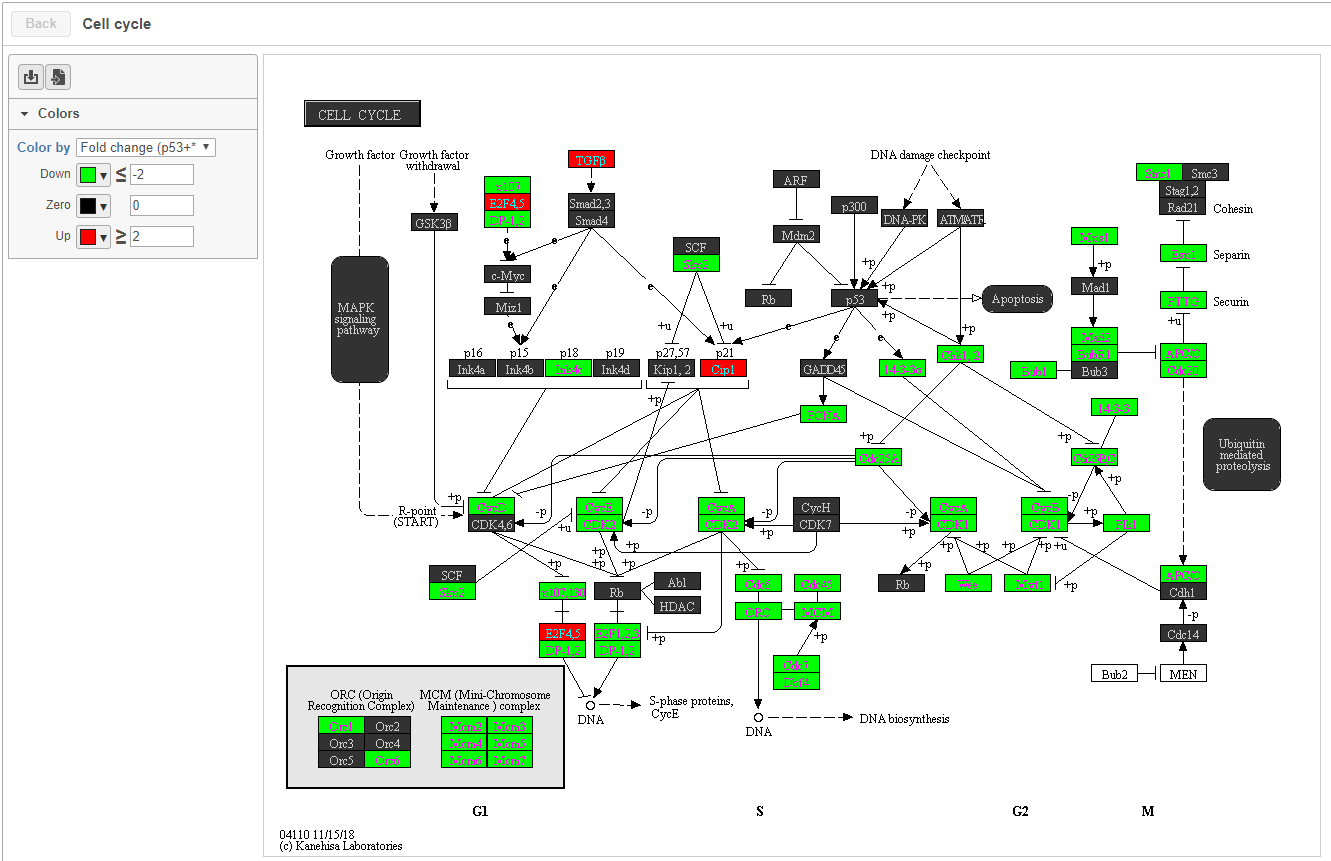
Figure 7. KEGG pathway map
Each rectangle on the map represents a gene product in the pathway. Gene products are mostly proteins coded by a gene or group of genes, but they could be RNA too. Related pathways are shown as large rounded rectangles. Chemical compounds, DNA or other molecules are shown as circles.
Coloring the map
The pathway map is colored by the first fold-change column in the input Feature list data node. The control panel on the left can be used to configure the colors of the pathway map. In all options, rectangles colored white do not have gene information. Options for coloring include:
- Fixed color: all genes are colored black.
- Genes in list: all genes in the list are colored, default color is yellow, but this can be configured. Genes not in the list are black.
- Statistics in the gene list: .e.g FDR, p-value, Fold change etc. Colors can be customized by clicking on the color square to change.
Feature details
Mousing over a rectangle shows the genes indicated by the rectangle in the tooltip (Figure 8). Genes are listed on rows with all aliases in the KEGG database included on the row. Genes that are in the list are shown in bold. The gene being used to color the rectangle is shown in red.
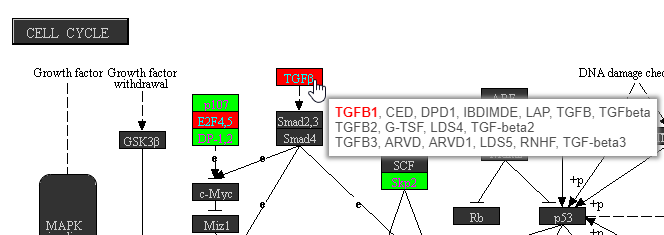
Figure 8. Checking genes represented by a rectangle
On KEGG pathway maps that include chemical compounds, the chemical structure is shown in the tooltip on mouse-over (Figure 9).
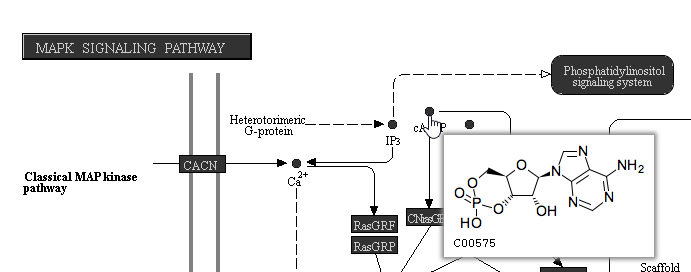
Figure 9. Viewing chemical compound
Clicking a rectangle opens the page for that gene or group of genes on the KEGG website in a new tab in your web browser.
Click the Save image ![]() icon to download a PNG file showing the configured KEGG pathway map to your local computer.
icon to download a PNG file showing the configured KEGG pathway map to your local computer.
Visualizing gene set enrichment results
If the gene set enrichment table has fewer than 100 results (rows), the GO categories can be visualized in the Data Viewer. Otherwise, a notification is displayed in the top left corner (Figure 10).
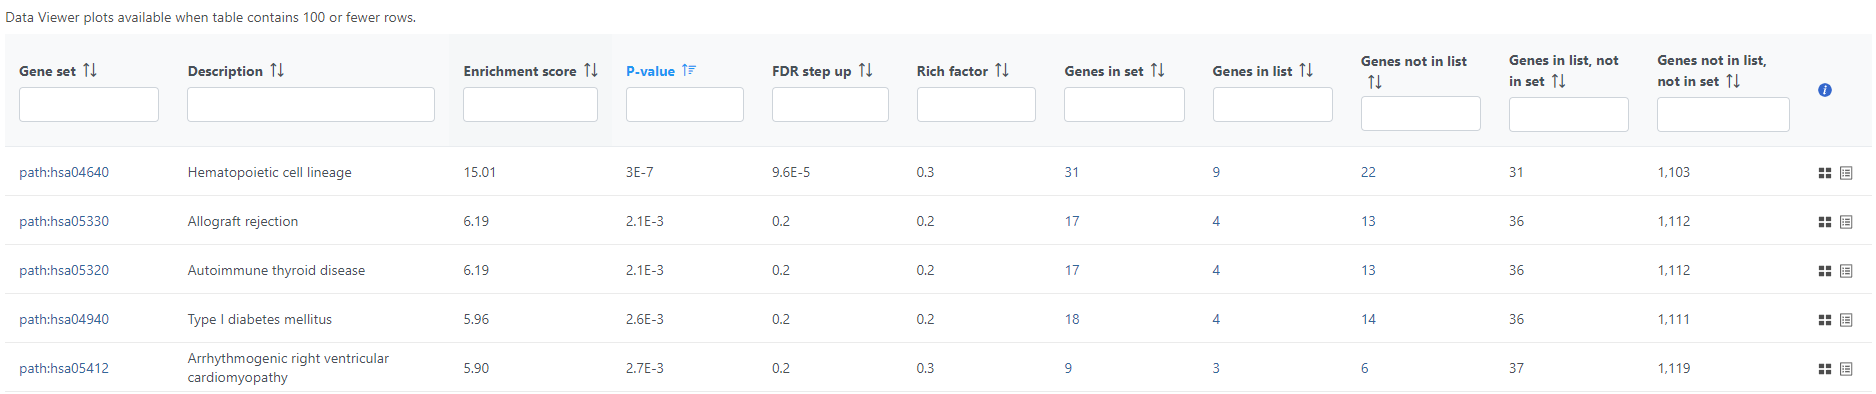 Figure 10. If the gene ontology table has more than 100 rows, visualization of results is not possible
If needed, filter down the number results, for instance by using a cut-off based on the enrichment score. Type in the cut-off value in the text box beneath the Enrichment score and hit enter (an example is shown in Figure 11). Once the number or results falls below 100, a link to the Data Viewer will be displayed (Figure 8). Click on the View plots in Data Viewer link to open a new Data Viewer session.
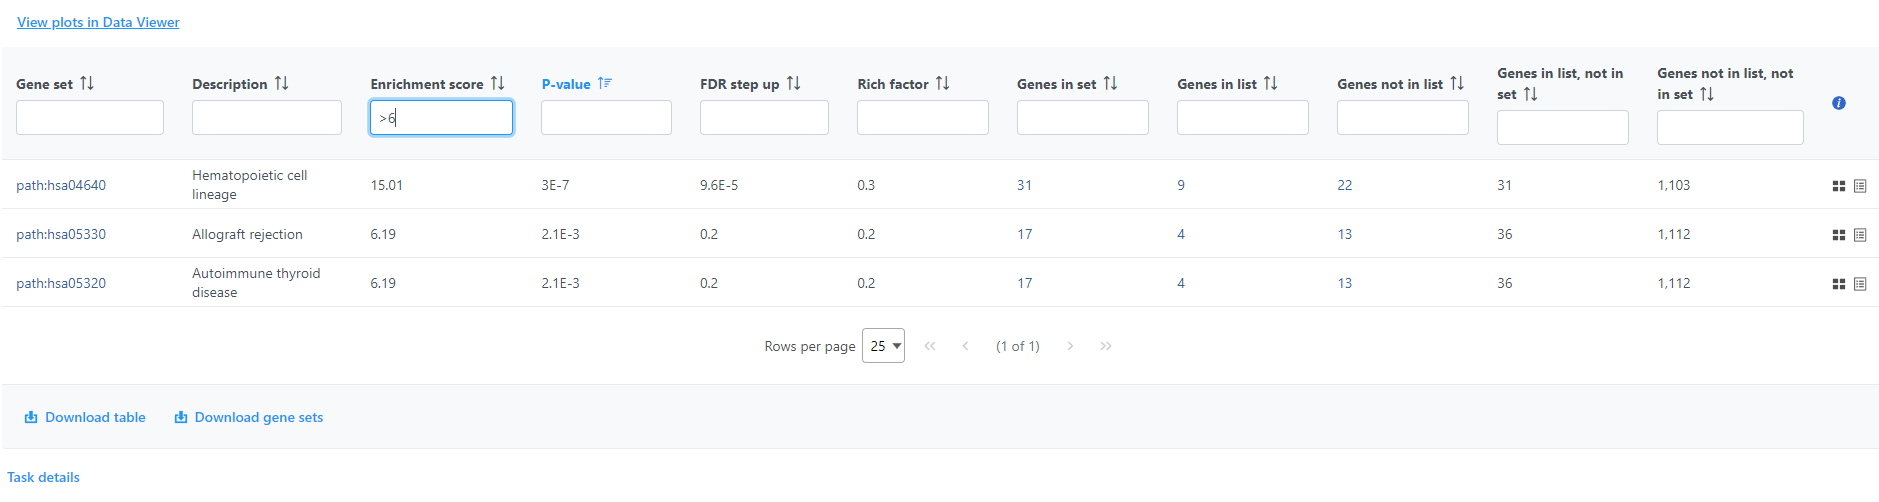 Figure 11. Use the View plots in Data Viewer link to visualize the gene ontology enrichment results. The link is not visible if the table contains more than 100 rows
Two plots are loaded into Data Viewer (Figure 12). Both plots show enrichment score on the horizontal axis and gene ontology categories (i.e. the ones present in the gene enrichment table) on the vertical axis. The plots show enrichments scores (Enrichment score column of the gene ontology table) and - in addition - the plot on the left uses color range to depict enrichment P-value (green = low, red = high P-value).
The same functionality is available for pathway enrichment results.
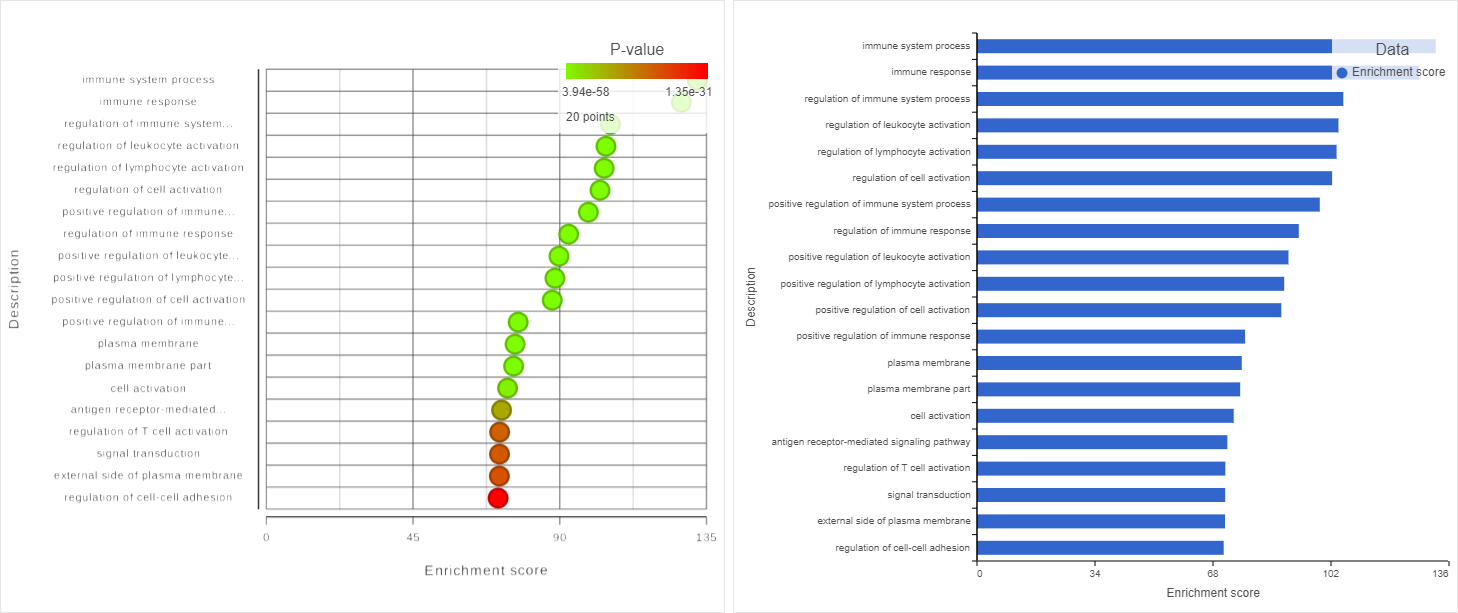 Figure 12. Visualizing gene ontology results. Vertical axis shows the gene ontology categories present in the underlying gene ontology table
References
- Ashburner M, Ball CA, Blake JA et al. Gene Ontology: tool for the unification of biology. Nat Genetics. 2000; 25:25-29.
- The Gene Ontology Consortium. Gene Ontology Consortium: going forward. Nucleic Acids Res. 2015; 43:D1049-1056.Recommended citations from the Geneontology.org website
Additional Assistance
If you need additional assistance, please visit our support page to submit a help ticket or find phone numbers for regional support.


| Your Rating: |
|
Results: |

|
40 | rates |
Overview
Content Tools
1 Comment
Melissa del Rosario
author: ilukic