A fusion gene is a hybrid gene that combines parts of two or more original genes. They can form as a result of chromosomal rearrangements (such as translocation, interstitial deletion, or chromosomal inversion) or abnormal transcription and have been shown to act as drivers of malignant transformation or/and progression in various neoplasms (1). The discovery and characterization of fusion genes have been greatly facilitated by the use of NGS (2) and several computational algorithms have been developed to detect them.
This chapter covers will illustrate how to detect fusion genes by:
STAR Algorithm
General Overview
The STAR aligner also has the ability to detect fusion genes (referred to as “chimeric alignments”) (5,6). During the first phase of alignment, STAR searches for maximal mappable prefixes (seeds) of sequencing reads. In the second phase, all the seeds that align within user-defined genomic windows are stitched together. If an alignment within one genomic window does not cover the entire read sequence, STAR will try to find two or more windows that cover the entire read. This essentially results in the detection of fusion events, with different parts of reads aligning to distal genomic locations, or different chromosomes, or different strands.
STAR fusion detection is performed in two steps: chimeric alignment of reads with the STAR aligner and fusion detection with STAR-Fusion. Performing fusion detection in two steps is equivalent to running the analysis in "Kickstart" mode, as described by the authors of STAR-Fusion. We recommend using STAR version 2.7.8a (see Task management to check which version you are running).
To save time, you can import the pre-built STAR-Fusion pipeline from our hosted pipeline page. This pipeline includes the two steps outlined below, where the advanced options for the STAR 2.7.8a alignment have been optimized for fusion detection according to the STAR-Fusion author's recommendations. See Importing a Pipeline for more information.
Running STAR Chimeric Alignment within Partek Flow
When performing an alignment with STAR, chimeric alignment can be activated by tick-marking the Chimeric alignment option in the Advanced options of the aligner (the Advanced options dialog is reached via the Configure link in the setup dialog). When the Chimeric alignment checkbox is selected, additional options specific to the fusion search algorithm are shown (Figure 11). For a discussion on the details of the options, see STAR documentation.
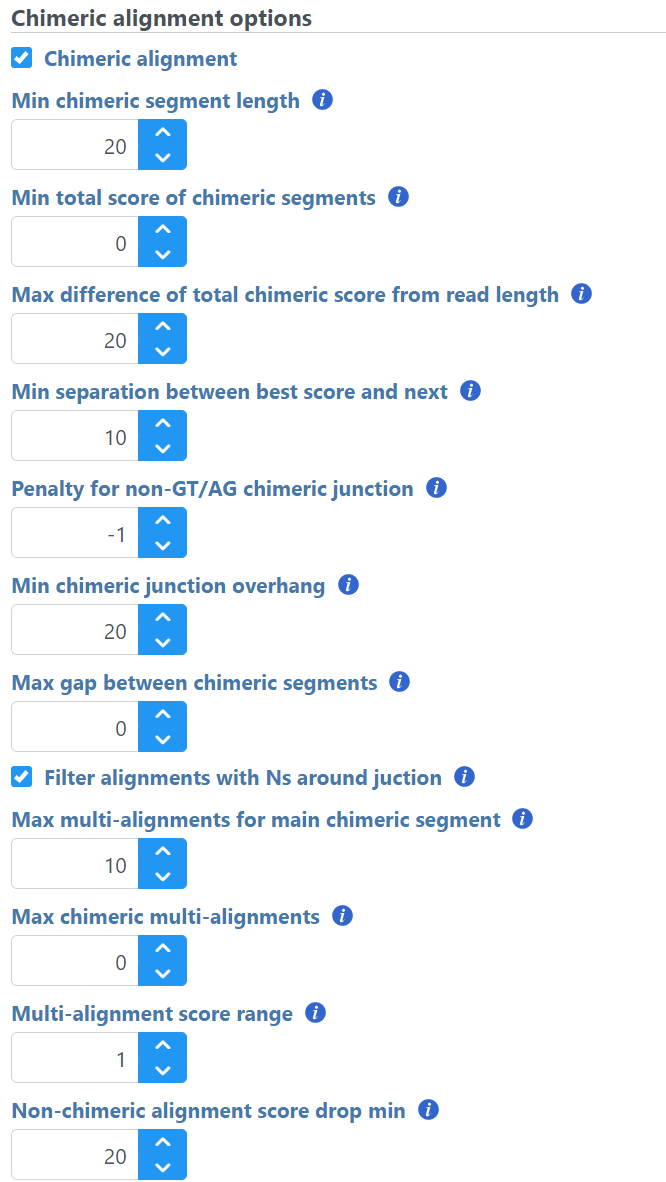
Figure 1. Controls of the STAR fusion gene detection algorithm (aligner defaults are shown)
The output is associated with the Chimeric junctions data node (Figure 12), which is a part of the STAR results in addition to Aligned reads node and, optionally, Unaligned reads node.
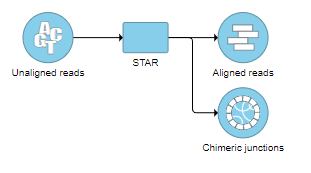
Figure 2. Chimeric results node as a result of STAR’s chimeric alignment algorithm
To obtain a .fusion file that summarizes the chimeric reads across samples, select the Chimeric results data node and click Download data in the toolbox (Figure 13). The file is human-readable and can be opened in a text editor (example in Figure 14). For details refer to STAR's documentation.
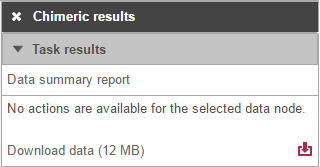
Figure 3. Chimeric results section of the toolbox, invokable on STAR’s chimeric alignment results (data size is an example)
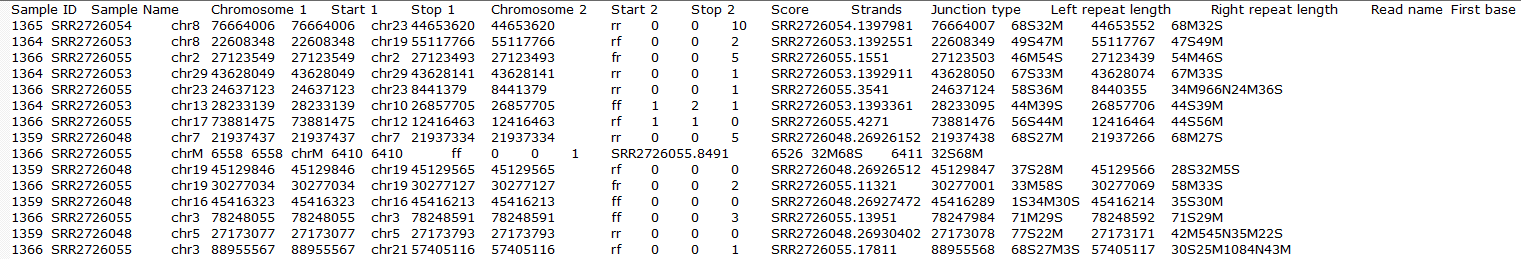 Figure 4. STAR's .fusion file opened in a text editor (example)
Running STAR-Fusion on Chimeric results
STAR-Fusion v1.10 is wrapped into Partek Flow. STAR-Fusion will process the chimeric output generated by the STAR aligner to map junction reads and spanning reads to a reference annotation set. To run fusion detection, select the Chimeric results data node and choose STAR-Fusion from the Variant analysis menu in the toolbox (Figure 15).
 Figure 5. Choose STAR-Fusion from the menu
Choose the STAR-Fusion annotation from the drop-down list. We provide automatic downloads of the plug-n-play libraries distributed by Trinity Cancer Transcriptome Analysis Toolkit (CTAT) for Human hg38 (Gencode v22 and v37) and hg19 (Gencode v19) assemblies (Figure 16). If you wish to add your own STAR-Fusion library, you can either import a pre-build CTAT library or gather the appropriate files and build it in Partek Flow. See here for more details on the files you need.
Figure 5. Choose STAR-Fusion from the menu
Choose the STAR-Fusion annotation from the drop-down list. We provide automatic downloads of the plug-n-play libraries distributed by Trinity Cancer Transcriptome Analysis Toolkit (CTAT) for Human hg38 (Gencode v22 and v37) and hg19 (Gencode v19) assemblies (Figure 16). If you wish to add your own STAR-Fusion library, you can either import a pre-build CTAT library or gather the appropriate files and build it in Partek Flow. See here for more details on the files you need.
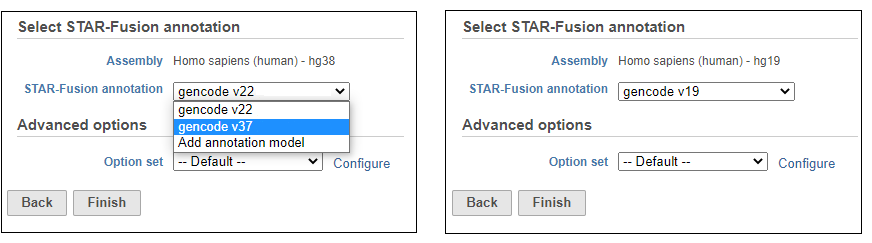 Figure 6. STAR-Fusion task set up
To change any of the advanced options, click the Configure link (Figure 17). To run the task, click Finish.
Figure 6. STAR-Fusion task set up
To change any of the advanced options, click the Configure link (Figure 17). To run the task, click Finish.
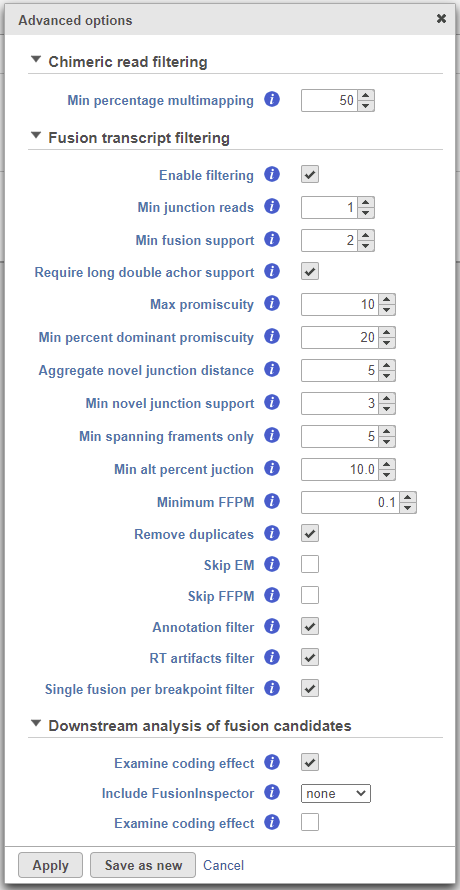 Figure 7. STAR-Fusion advanced options
The resulting Fusion predictions task node (Figure 18) can be downloaded to your local machine by selecting the data node and clicking Download data from the toolbox. There will be one tab-separated (.tsv) file per sample. To view the full table, double-click the new data node to open the task report (Figure 19). Each row of the table is a fusion event and the columns contain information about each detected fusion.
Figure 7. STAR-Fusion advanced options
The resulting Fusion predictions task node (Figure 18) can be downloaded to your local machine by selecting the data node and clicking Download data from the toolbox. There will be one tab-separated (.tsv) file per sample. To view the full table, double-click the new data node to open the task report (Figure 19). Each row of the table is a fusion event and the columns contain information about each detected fusion.
- FusionName: the name of the fusion event, given as LeftGene--RightGene. Multiple fusion events can be detected across the same pair of genes, so the FusionName of an event is not necessarily unique;
- JunctionReadCount: indicates the number of RNA-Seq fragments containing a read that aligns as a split read at the site of the putative fusion junction;
- SpanningFragCount: indicates the number of RNA-Seq fragments that encompass the fusion junction such that one read of the pair aligns to a different gene than the other paired-end read of that fragment;
- est_J: estimated junction read counts corrected for multiple mappings;
- est_S: estimated spanning fragment counts corrected for multiple mappings;
- SpliceType: indicates whether the proposed breakpoint occurs at reference exon junctions as provided by the reference transcript structure annotations (Gencode);
- LeftGene: name of the first (left) gene;
- LeftBreakpoint: genome coordinates for the breakpoint in left gene;
- RightGene: name of the second (right) gene;
- RightBreakpoint: genome coordinates for the breakpoint in right gene;
- JunctionReads: sequence identifiers for all junction reads;
- SpanningFrags: sequence identifiers for all spanning fragments;
- LargeAnchorSupport: indicates whether there are split reads that provide 'long' (set to 25bp) alignments on both sides of the putative breakpoint;
- FFPM: fusion fragments per million reads
- LeftBreakDinuc: dinucleotide base pairs at the left breakpoint
- LeftBreakEntropy: the Shannon entropy of the 15 exonic bases flanking the left breakpoint
- RightBreakDinuc: dinucleotide base pairs at the right breakpoint
- RightBreakEntropy: the Shannon entropy of the 15 exonic bases flanking the right breakpoint
- annots: provides a simplified annotation for fusion transcript
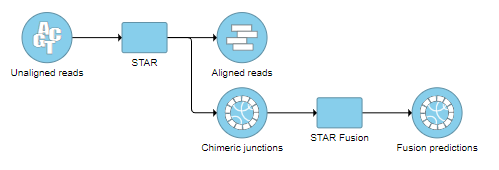 Figure 8. Fusion predictions data node
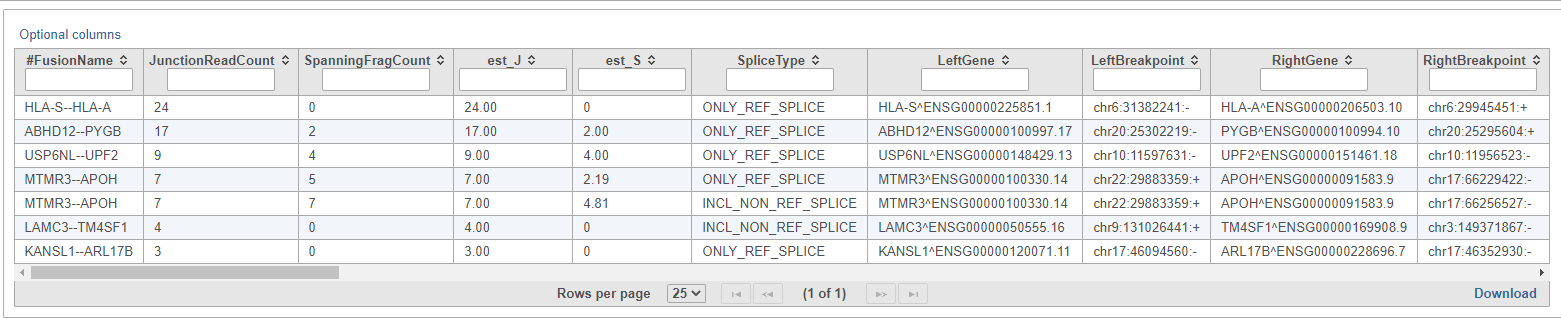 Figure 9. STAR-Fusion fusion prediction table
TopHat-Fusion Algorithm
General Overview
TopHat-Fusion is a version of TopHat with the ability to align reads across fusion points and detect fusion genes resulting from breakage and re-joining of two different chromosomes or from rearrangements within a chromosome (3). It is independent of gene annotation and can discover fusion products from known genes, unannotated splice variants of known genes or completely unknown genes.
The reads are first aligned to the genome. The unaligned reads resulting from this initial alignment are split into multiple 25 bp sequences which are, in turn, aligned to the genome by Bowtie. The TopHat-Fusion algorithm identifies the cases where the first and the last 25 bp segments are aligned to either two different chromosomes or two locations on the same chromosome (spacing is defined by the user). The whole read is used to identify a fusion point. After the initial fusion candidates are defined, all the segments from the initially unaligned reads are realigned against the fusion points (as well as intron boundaries and indels). The resulting alignments are combined with the full read alignments.
The most up-to-date TopHat-Fusion version implemented in Partek® Flow® when the manual was written (2.1.0) focuses on fusions due to chromosomal rearrangements, while fusions resulting from read-through transcription or trans-splicing were not supported. For details as well as discussion of TopHat-Fusion options, see TopHat-Fusion home page (4).
Running TopHat-Fusion within Partek Flow
TopHat-Fusion is integrated in the TopHat 2 task and is invoked by using the Fusion search check box in the Alignment options dialog (Figure 1).
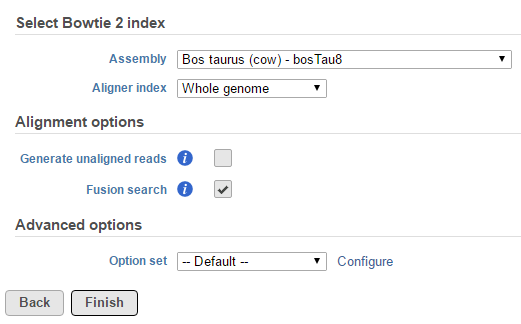
Figure 10. Activating TopHat-Fusion algorithm for detection of fusion genes (bovine genome shown as an example)
The output is generated as a new data node Fusion results (Figure 2) stemming as part of the if the TopHat 2 align reads task (in addition to Aligned reads node and, optionally, Unaligned reads node).
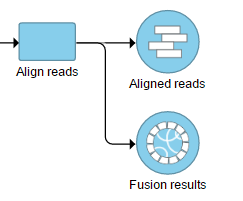
Figure 11. Fusion results node as a result of TopHat-Fusion algorithm
Selecting the Fusion results data node opens the task menu, with four options (Figure 3): Data summary report, Fusion report, Fusion attribute report, and Download data.
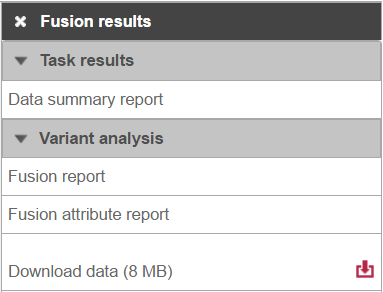 Figure 12. TopHat-Fusion results section of the toolbox, invokable on TopHat-Fusion's results (data size is an example)
Clicking the Download data downloads a *.fusion file to the local computer. The file is human-readable and can be opened in a text editor (example in Figure 4). For details refer to TopHat-Fusion documentation.
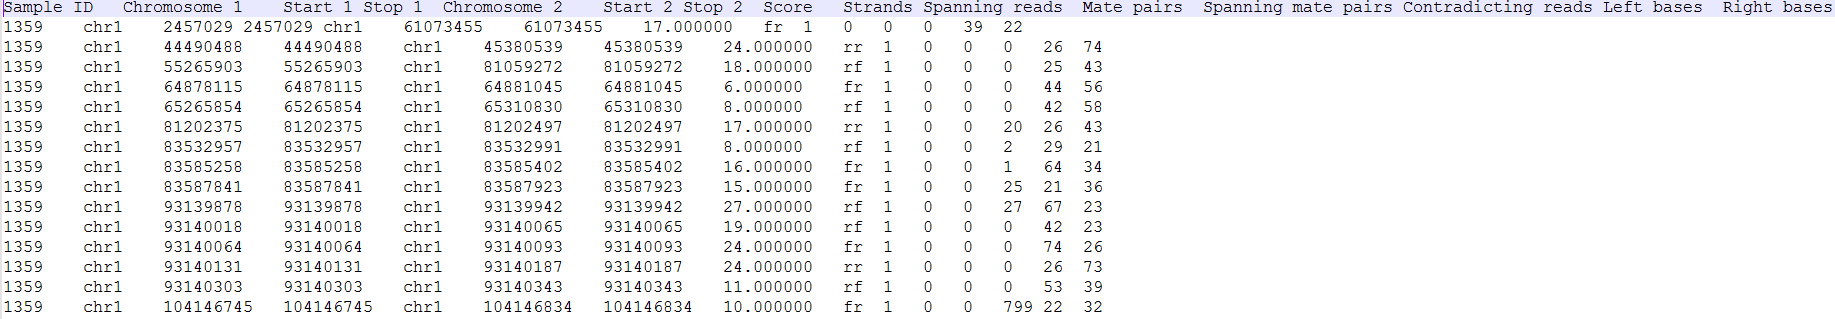 Figure 13. TopHat-Fusion's .fusion file opened in a text editor (example)
A list of annotated fusion genes, in a form of Fusion report can be obtained by first selecting the Fusion report task node (Figure 2) and then the Task report link from the task menu (Figure 3). Since the task provides an annotated report, an annotation file needs to be specified first (Figure 5).
Figure 13. TopHat-Fusion's .fusion file opened in a text editor (example)
A list of annotated fusion genes, in a form of Fusion report can be obtained by first selecting the Fusion report task node (Figure 2) and then the Task report link from the task menu (Figure 3). Since the task provides an annotated report, an annotation file needs to be specified first (Figure 5).
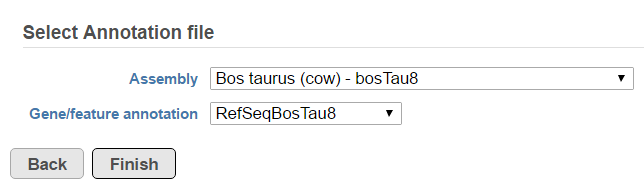
Figure 14. Selecting an annotation file to annotate TopHat-Fusion results (an example)
The resulting Fusion report task node (Figure 6) can be double-clicked to reveal the full table (Figure 7).
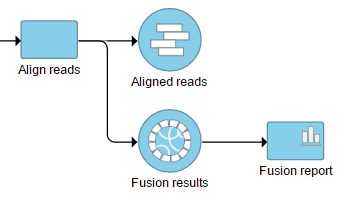
Figure 15. Fusion report task node as a result of annotating Fusion results generated by TopHat-Fusion algorithm
Each row of the table in Figure 7 is a potential fusion event, with the columns providing the following information.
- Sample ID: sample in which the fusion event was identified
- Chromosome 1: chromosome hosting the first (left) segment of the fusion transcript
- Stop 1: end of the first (left) segment of the fusion transcript
- Chromosome 2: chromosome hosting the second (right) part of the fusion transcript
- Start 2: beginning of the second (right) segment of the fusion transcript
- Gene1: gene on the left side of the fusion
- Gene2: gene on the right side of the fusion
- Spanning reads: number of reads which were unaligned during the initial phase of TopHat and where only one mate is used as evidence of the fusion event
- Mate Pairs: number of reads which were unaligned during the initial phase of TopHat and where both mates are used as evidence of the fusion event
- Spanning mate pairs: number of reads where both mates were aligned during the initial phase of TopHat, but their pairing is discordant (e.g. different chromosomes, different orientation etc.)
- Contradicting reads: number of reads which do not support the fusion
- Left bases: number of bases on the left side of the fusion
- Right bases: number of bases on the right side of the fusion
All the columns can be sorted by using the arrow buttons in column headers, while the type-in boxes can be used for searching. TopHat-Fusion does not report exact start and stop position for each side of the fusion event. It has a single location for the end of the upstream segment (Stop 1) and the beginning of the downstream segment (Start 2). Therefore, columns Start 1 and Stop 2 are added for (internal) consistency with other Partek Flow tools.
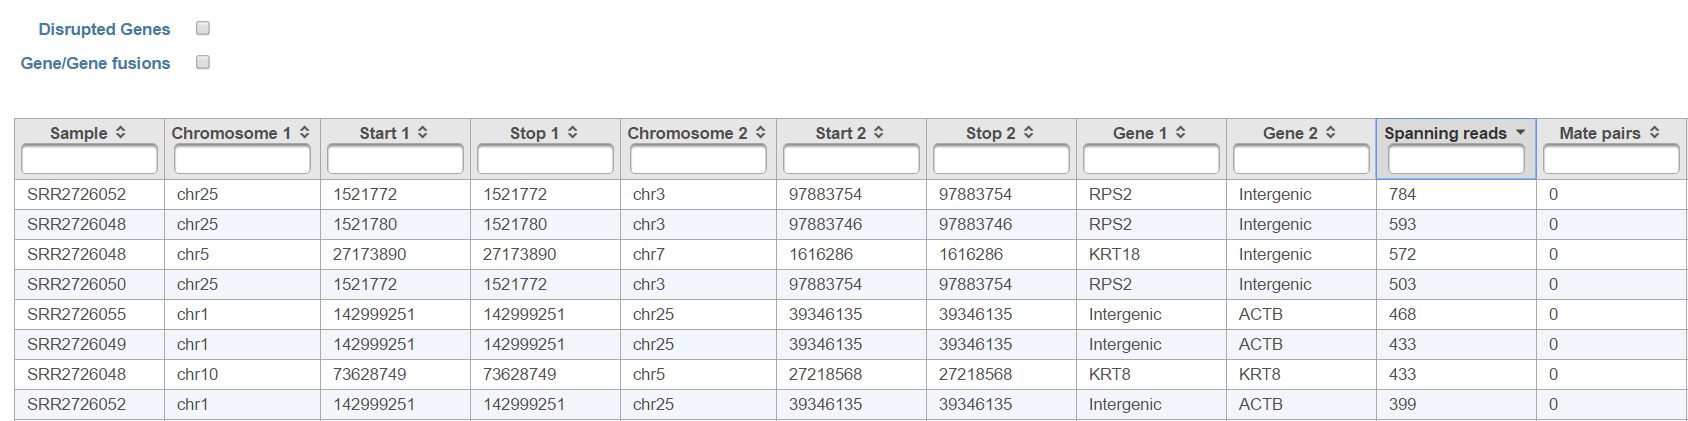
Figure 16. Fusion report of TopHat-Fusion fusion gene detection algorithm. Each row represents a fusion gene candidate (an example is shown) (table truncated)
The checkboxes Disrupted Genes and Gene/Gene fusions are filter tools. When selected, Disrupted Genes removes all the rows (fusion events) which have no genes assigned to it, i.e. those that merge two intergenic regions. However, if there is a fusion between a gene and an intergenic region, it will be kept in the table. The Gene/Gene fusions filters in only those fusion events which have an annotated gene on both sides of the breakpoint. In other words, only gene to gene fusions are kept in the table.
Another table which can be generated based on a Fusion results node is the Fusion attribute report (Figure 3). When the option is selected, it brings up the dialog shown in Figure 8. First, you need to specify one or more categorical attributes (Select attribute(s) to test), which have at least two categories (see Data tab). Second, you need to specify an annotation file, using the Assembly and Gene/feature annotation drop-down lists.
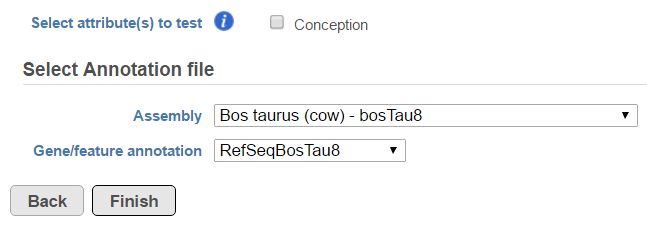
Figure 17. Selecting attributes to be tested for association with fusion events (the attribute Conception and the annotation files are an example)
A new data node, Fusion attribute report, is generated in the Analysis tab (Figure 9) and it provides access to the Task report link in the task menu.
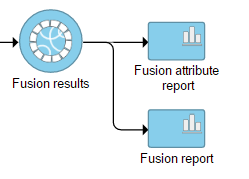
Figure 18. Fusion attribute report node as a result of annotating Fusion results generated by TopHat-Fusion algorithm
The output, Fusion report table (Figure 10) resembles the basic TopHat-Fusion output (Figure 7); each row of the table is a single fusion event while the information on the merged segments is on the columns.
- Chromosome 1: chromosome hosting the first (left) segment of the fusion transcript;
- Start 1: beginning of the first (left) segment of the fusion transcript;
- Stop 1: end of the first (right) segment of the fusion transcript;
- Chromosome 2: chromosome hosting the second (right) segment of the fusion transcript;
- Start 2: beginning of the second (right) segment of the fusion transcript;
- Stop 2: end of the second (left) segment of the fusion transcript;
- Gene1: gene on the left side of the fusion;
- Gene2: gene on the right side of the fusion;
- % in (category name): fraction of samples within the category with the fusion event.
The checkboxes Disrupted Genes and Gene/Gene fusions are filter tools. When selected, Disrupted Genes removes all the rows (fusion events) which have no genes assigned to it, i.e. those that merge two intergenic regions. However, if there is a fusion between a gene and an intergenic region, it will be kept in the table. The Gene/Gene fusions filters in only those fusion events which have an annotated gene on both sides of the breakpoint. In the other words, only gene to gene fusions are kept in the table.
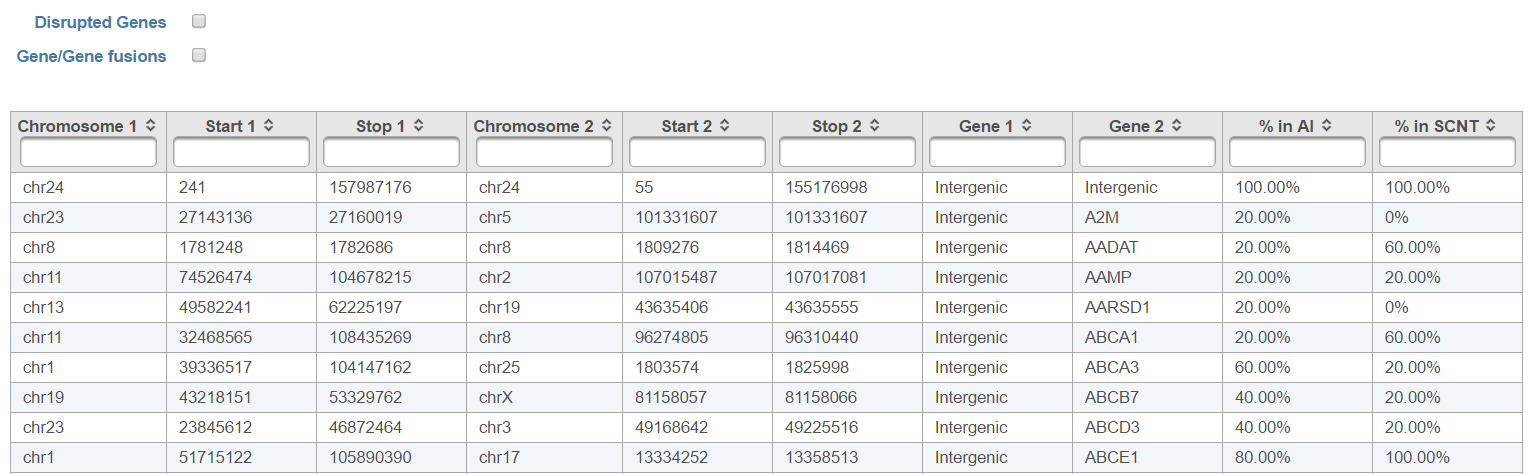
Figure 19. Fusion attribute report of TopHat-Fusion fusion gene detection algorithm. Each row represents a fusion gene candidate (the example shows comparison of number of fusion events detected in the AI group vs. the SCNT group)
References
- Annala MJ, Parker BC, Zhang W, Nykter M. Fusion genes and their discovery using high throughput sequencing. Cancer Lett. 2013;340:192-200.
- Costa V, Aprile M, Esposito R, Ciccodicola A. RNA-Seq and human complex diseases: recent accomplishments and future perspectives. Eur J Hum Genet. 2013;21:134-142.
- Kim D, Salzberg SL. TopHat-Fusion: an algorithm for discovery of novel fusion transcripts. Genome Biology. 2011;12:R72
- TopHat-Fusion. An algorithm for discovery of novel fusion transcripts. http:// http://tophat.cbcb.umd.edu/fusion_index.html Accessed on April 25, 2014
- Dobin A, Davies CA, Schlesinger F et al. STAR: ultrafast universal RNA-seq aligner. Bioinformatics. 2013;29:15-21.
- Haas B.J, Dobin A, Li B. et al. Accuracy assessment of fusion transcript detection via read-mapping and de novo fusion transcript assembly-based methods. Genome Biol. 2019;20:213 (2019)
Additional Assistance
If you need additional assistance, please visit our support page to submit a help ticket or find phone numbers for regional support.


| Your Rating: |
|
Results: |

|
39 | rates |
Overview
Content Tools
1 Comment
Melissa del Rosario
author: ilukic